
Analysts expect the bear market to loosen its dominance in 2023. Crypto analyst Rakesh Upadhyay analyzes five cryptocurrencies you should keep an eye on.
The leading cryptocurrency Bitcoin (BTC) is in the first place.
The broader cryptocurrency market is unlikely to initiate a new bull phase until Bitcoin makes a comeback. Bitcoin has been in a strong downtrend for the past few months. Despite this, the relative strength index (RSI) is forming a positive divergence. This indicates that the bearish momentum is weakening.
However, a positive divergence can result in a positive price move to confirm a trend change. The first sign of strength will be a break and close above the 20-week exponential moving average (EMA) at $19,870. It is possible for BTC to rally to $25,211, where the bears will again make a strong defense. If the price drops from this level and then bounces back from the 20-week EMA, it will signal a change in sentiment from selling on rallies to buying on dips. This is likely to increase the likelihood of a break above $25,211.
It is possible for BTC to rise to the 50-week simple moving average (SMA) at $28,156 later. This remains the key level the bears must defend. Because a break above this is likely to mark the start of a new uptrend. The bears could face a minor hurdle near $32,400. However, this is likely to be exceeded. Thus, it is possible for BTC to rise to $50,000. However, if the price breaks from the current level or the 20-week EMA and dips below $15.476, the downtrend is likely to continue. The next major support on the downside is $12,500 and $10,000.

cryptocoin.comAs you follow, the cryptocurrency has been trading below the $17,622 breakout level for a few days. However, the bears failed to take advantage and continued the downtrend. This indicates that sales are drying up at lower levels. The 20-day EMA ($17,021) has flattened and the RSI is near the midpoint. This indicates that the bears may be losing their grip. If buyers push the price above the overhead resistance, this will signal a potential trend change. A confirmation will occur after the bulls turn the $17,622 level to support. This is likely to set the stage for a rally to $25,211
In second place is the leading altcoin Ethereum (ETH).
Cryptocurrency is in a strong downtrend. A small positive point, however, is finding support near the psychological level of $1,000. Repeated rises to the 20-week EMA ($1,428) also indicate occasional buying by the bulls.
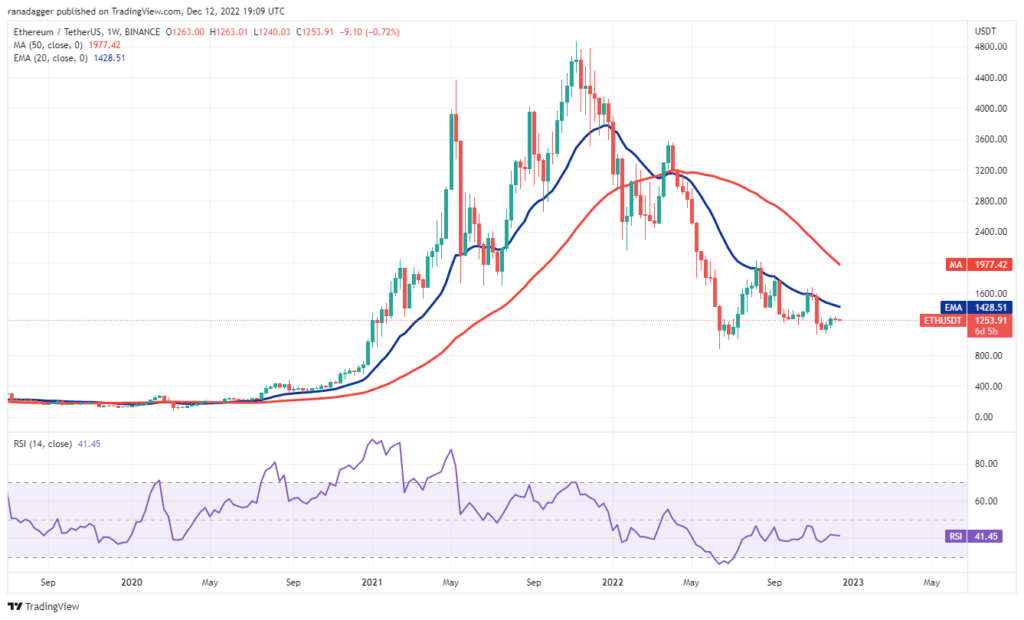
Three rallies over the past few weeks have been rejected at the 20-week EMA. However, the bears failed to push ETH to the June low of $881. This shows that traders are buying the lows. If the bulls push and sustain the price above the 20-week EMA, they could close their short positions for a few more months. This is likely to result in a rally to the overhead resistance at $2,030. The 50-week SMA ($1,977) is pretty close. Therefore, it is possible that this level will be a major hurdle for the bulls.
ETH will complete the double bottom pattern if buyers push the price above $2,030. This reversal setup has a target target of $3,200. However, the rally is likely to extend to $3,600. The zone between $3,600 and $4,000 is likely to be a major hurdle for the bulls. If the bears want to capitalize on this rally, they will have to push and sustain the price below $881.

The coin is trading within a descending channel pattern. However, the RSI is near the midpoint as the 20-day EMA ($1,255) flattens out. This indicates that buyers are trying to make a return. If the bulls push the price above the 50-day SMA ($1,326), ETH is likely to rise to the resistance line of the channel. This is the key level to watch out for. Because a break above this will suggest the end of the downtrend. It is possible for ETH to rally to $1,800 and then $2,030 later. On the contrary, if the price drops from the current level or overhead resistance, the bears will try to pull ETH to the support line of the channel.
Third cryptocurrency Polygon (MATIC)
Several major cryptocurrencies are under threat of falling below their June lows. However, MATIC has outperformed as it tries to form a bottom well above its annual low.

MATIC broke above the 50-week SMA ($1.05) a few weeks ago. However, the bulls failed to sustain the rise. This indicates that the bears are active at higher levels. An encouraging sign is that the bulls are not allowing the price to drop below the critical support at $0.69.
The 20-week EMA ($0.88) has flattened. Also, the RSI is close to the centre, showing a balance between supply and demand. The first sign of strength will be a break above $1.05. It is possible that this will increase the possibility of a retest of $1.30. This is an important level for bears to defend. Because, a break above this will likely mark the start of a new uptrend. MATIC is likely to rise to $1.75 where the bears will again be a strong challenge. If this resistance is surpassed, it is possible for MATIC to gain momentum and rise to $2.92. The bears will gain the upper hand if they sink the price below $0.69. This is likely to clear the way for a drop to $0.31.

MATIC has been stuck between $1.05 and $0.69 for several days. The breakout above $1.05 on Nov. 4 turned out to be a trap as the bears pulled the price below $1.05 on Nov. 8. Since then, the MATIC has continued its range-bound action. The longer the price stays inside the range, the stronger its breakout will be. The next break above $1.05 is possible, increasing the possibility of a rally above $1.30. If this happens, the bullish momentum could increase and the pair could climb to the psychological $2 level. Alternatively, a break below $0.69 is likely to turn the advantage in favor of the bears. It is possible for MATIC to drop to $0.40 first. Then it is likely to retest the vital support of $0.31.
Toncoin (TON) is also on the list
The TON has been gradually rising since the June low of $0.74. Traders bottomed higher at $1.18 in October. This is a sign of strength.
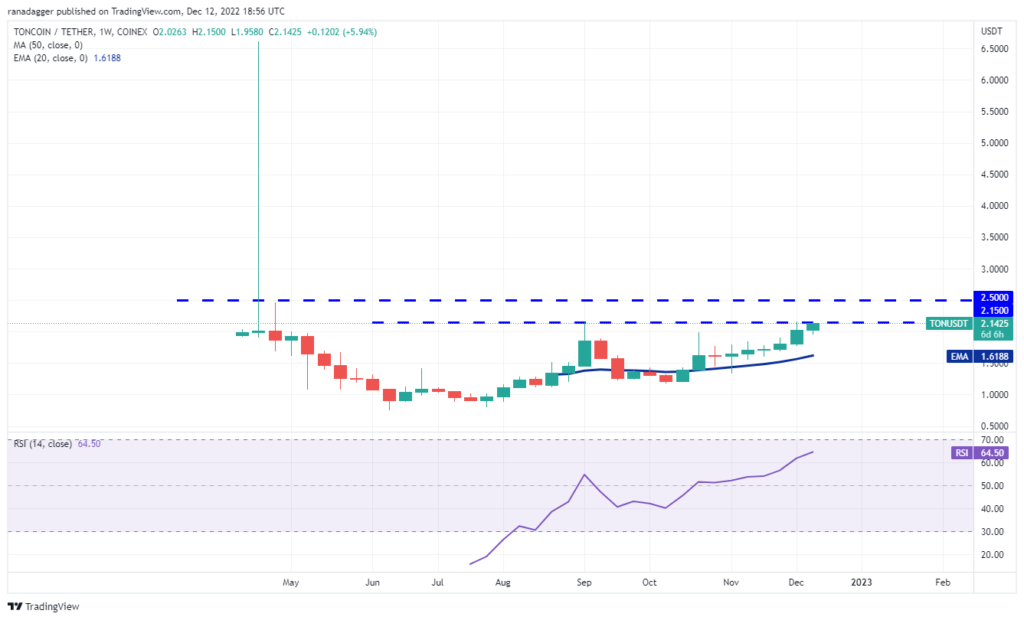
TON’s upward move has reached the overhead resistance zone between $2.15 and $2.50. The bears will try to stop the bulls’ march in this area. If they do, it is possible for the TON to drop to the 20-week EMA ($1.61) and then to $1.18. If this support gives way, TON is likely to retest June lows of $0.74. If the bulls want to maintain their advantage, they will have to bulldoze through the hill area. TON is likely to attract big purchases if it stays above $2.50 as there is no major overhead resistance above this level. The next stop on the upside will likely be $4.26.

The bulls tried to push the price above $2.15 on Dec. But the bears held their ground, as seen from the long wick in the day’s candlestick. However, the bulls did not give up and are trying to rise above the general resistance again on December 12. The upward sloping moving averages and the RSI in the overbought zone indicate that the path of least resistance is to the upside. TON is likely to rise above $2.15 to $2.50. It is possible that this level will act as resistance on the downtrend. However, if the bulls turn the $2.15 level to support, it will increase the chances of a rise above $2.50. The bears will have to push and sustain the price below the moving averages to weaken the short-term strength. The TON is likely to drop to $1.50 and then $1.20 later.
Latest cryptocurrency Quant (QNT)
QNT rose from $40 in June to $228 in October. This sharp rise in the middle of the bear phase indicates strong demand from traders. Cryptocurrency has given back most of its gains. However, buyers are attempting to form a higher low near $87.
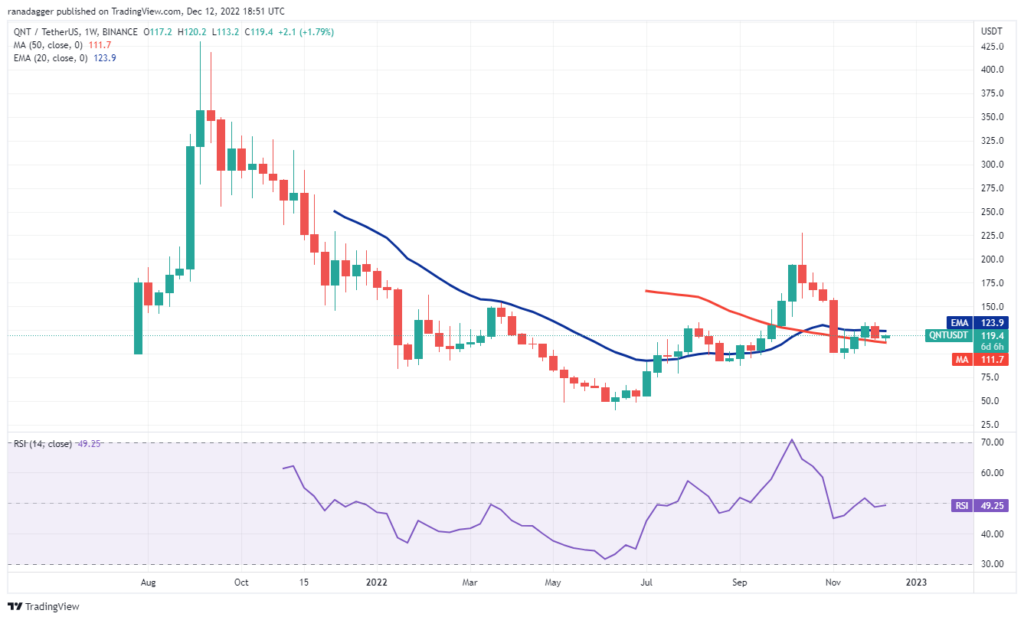
After the volatile movements of the past few weeks, QNT will likely enter a consolidation phase where the bulls and bears are fighting for supremacy. The limits of the wide range are at $87 on the downside and $228 on the upside. A well-defined range gives traders the opportunity to buy near support and take profits near resistance. If the bulls propel the price above $228, QNT is likely to accelerate towards $325. However, it is possible that this level will act as a roadblock. However, if this exceeds, it is possible for QNT to retest $430. If the price drops and dips below $87, it will show that the bears are in command. QNT is likely to drop to $50 later.
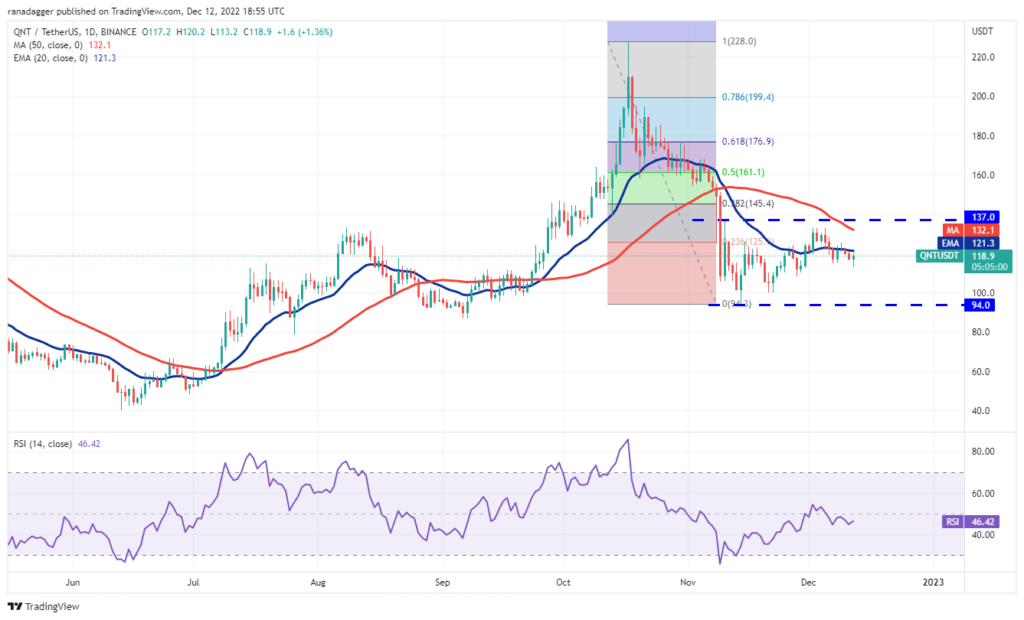
After the sharp drop from $228 to $94, QNT is likely to spend some time in a range. The important level to watch on the upside is $137 and on the downside $94. If the bulls propel the price above $137, a rally to the 61.8% Fibonacci retracement level of $176 is possible for QNT. Bears will aggressively defend this level. Because a break above this is likely to complete a 100% retracement and result in a rise to $228. However, if the price breaks below $94 in the near term, it indicates a resumption of the downtrend.
Contact us to be instantly informed about the last minute developments. twitter‘in, Facebookin and InstagramFollow and Telegram and YouTube join our channel!
Risk Disclosure: The articles and articles on Kriptokoin.com do not constitute investment advice. Bitcoin and cryptocurrencies are high-risk assets, and you should do your due diligence and do your own research before investing in these currencies. You can lose some or all of your money by investing in Bitcoin and cryptocurrencies. Remember that your transfers and transactions are at your own risk and any losses that may occur are your responsibility. Cryptokoin.com does not recommend buying or selling any cryptocurrencies or digital assets, nor is Kriptokoin.com an investment advisor. For this reason, Kriptokoin.com and the authors of the articles on the site cannot be held responsible for your investment decisions. Readers should do their own research before taking any action regarding the company, assets or services in this article.
Disclaimer: Advertisements on Kriptokoin.com are carried out through third-party advertising channels. In addition, Kriptokoin.com also includes sponsored articles and press releases on its site. For this reason, advertising links directed from Kriptokoin.com are on the site completely independent of Kriptokoin.com’s approval, and visits and pop-ups directed by advertising links are the responsibility of the user. The advertisements on Kriptokoin.com and the pages directed by the links in the sponsored articles do not bind Kriptokoin.com in any way.
Warning: Citing the news content of Kriptokoin.com and quoting by giving a link is subject to the permission of Kriptokoin.com. No content on the site can be copied, reproduced or published on any platform without permission. Legal action will be taken against those who use the code, design, text, graphics and all other content of Kriptokoin.com in violation of intellectual property law and relevant legislation.