
What we call technical analysis helps us to detect repetitive price movements and reduce the risks in the position beforehand.

Bitcoin has faced many comparisons with the rally it started in 2020. While some analysts thought that it was a bull similar to the 2013 bull and would be long-term, some analysts claimed that the price movements in the 2017 bull were exactly repeated.
We also noted many similarities to previous cycles in our analyses.
Looking at Bitcoin’s price action, we noticed another overlooked similarity. Although not taken into account, we have seen that there are price movements in Bitcoin very similar to the rally in 2019.

When we look at the price movements after the decline from the peak in 2019 and 2021, we encountered the following table.
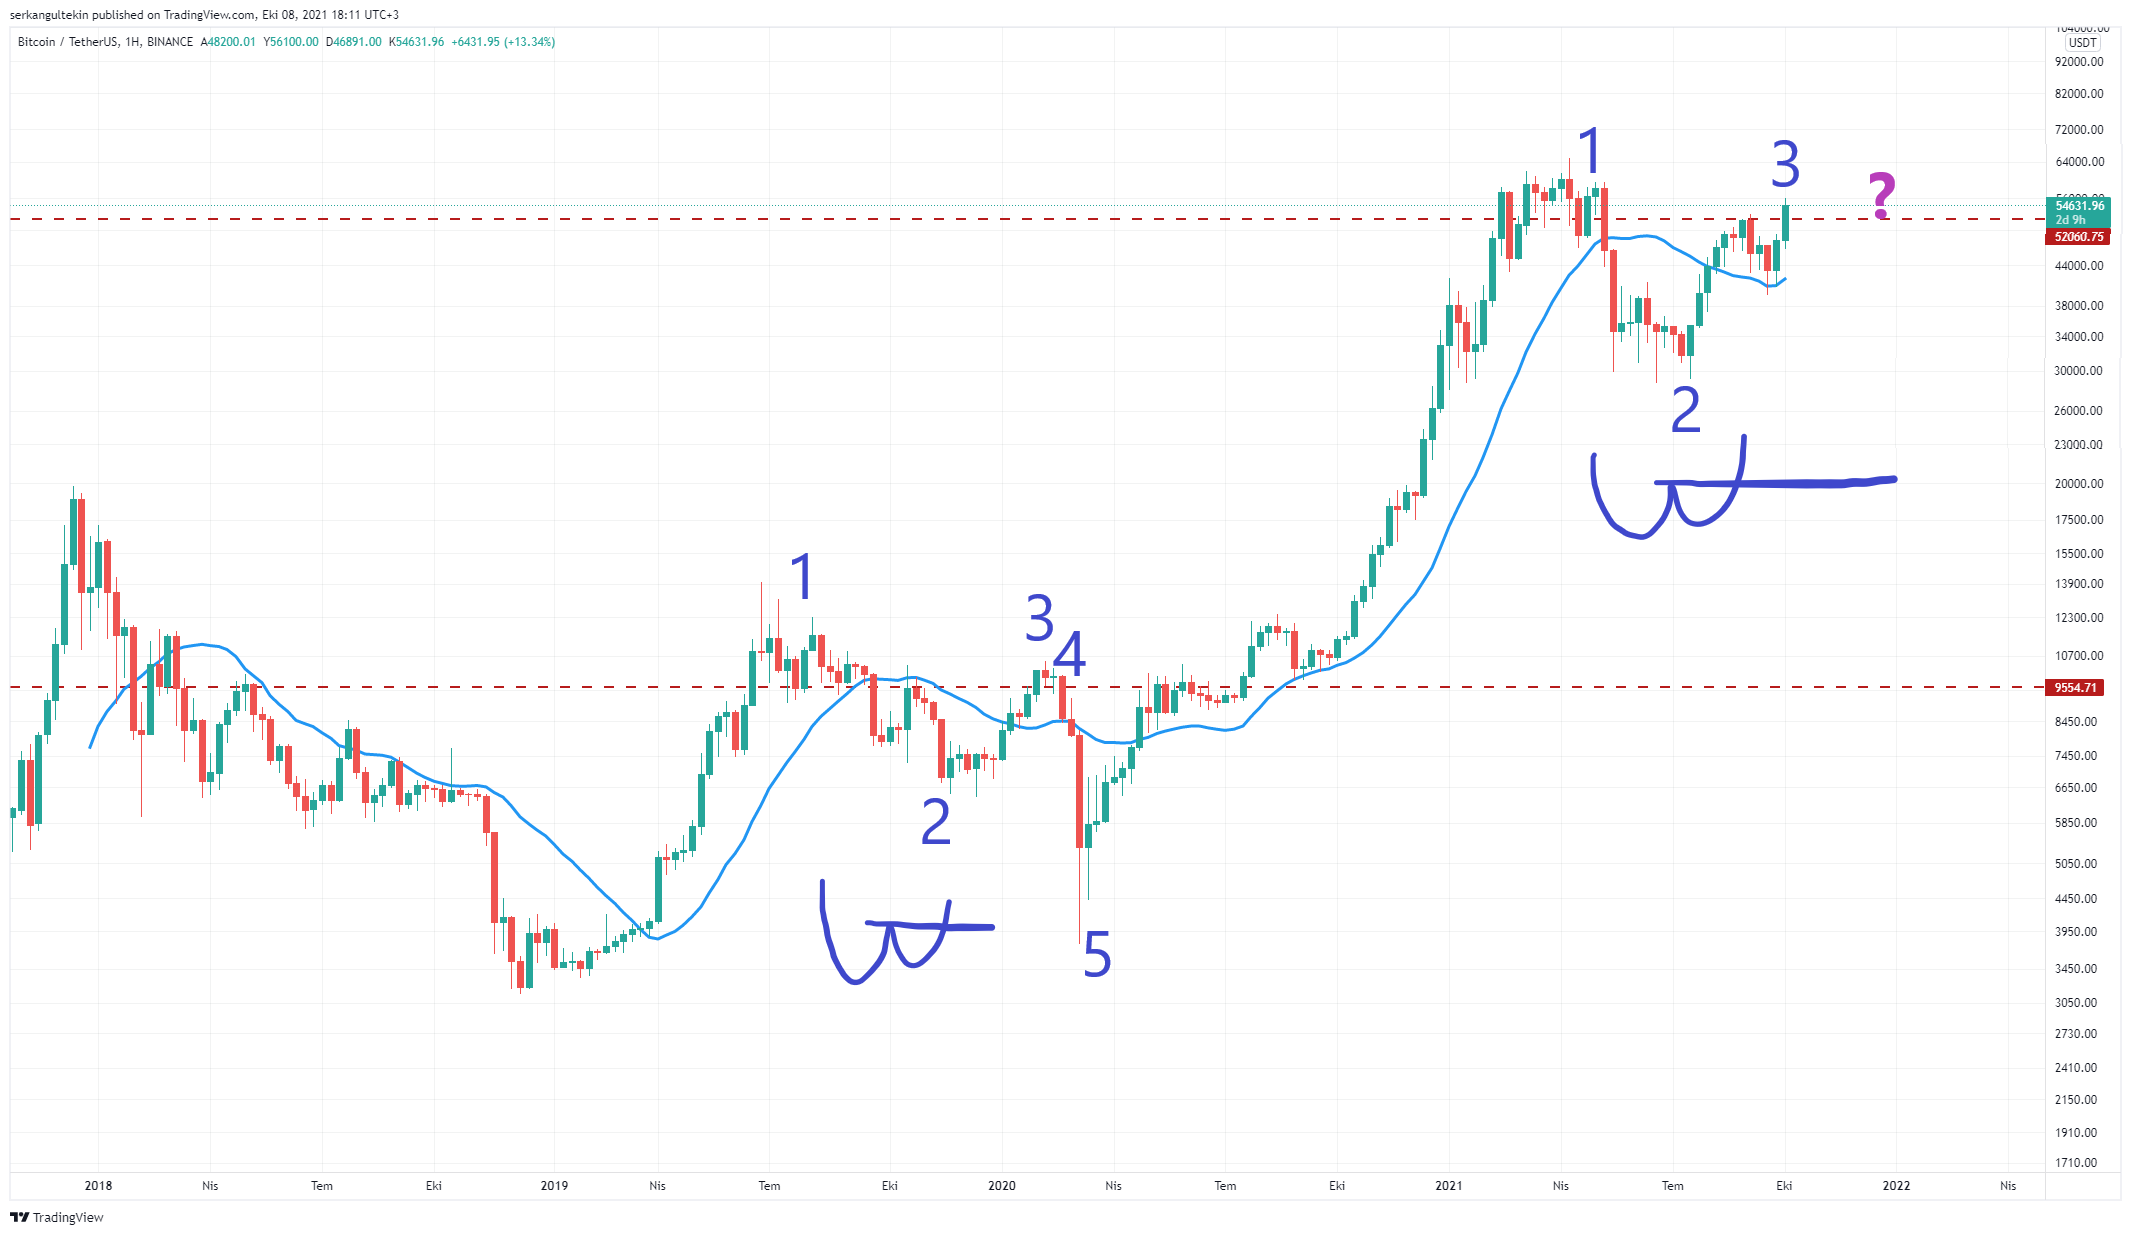
Year 2019:
1- Decline below the weekly ma20 with a decrease of 54% from the peak.
2- A 15-week sideways trend below the weekly ma20.
3- Persistence above the weekly ma20 and weekly close on the W formation to increase the risk appetite of the investors.
4- 2 weeks horizontal course.
5- New rally after 63% correction. (COVID FALL)
Year 2021:
1- Decline below the weekly ma20 with a 55% decrease from the peak.
2- A 12-week horizontal course below the weekly ma 20.
3- Weekly ma20 permanence and weekly closing on W formation, which will increase the risk appetite of investors (there has not been a week’s closing yet. Written as an assumption.)
We do not know if this similarity will continue. However, we talk about the importance of the weekly ma20 in every analysis.
If the 4th item in 2019 happens again and Bitcoin stays flat at these levels for 2 weeks, we can see a mini rally in altcoins in the coming days. Because in February 2020, during these two weeks when Bitcoin went sideways, Ethereum increased by 30%.
Unless there is a crisis that will affect the markets deeply, we can skip the 5th item. At this point, we should be careful about the price movements after the 20th and see that $51800 is not broken.
$51800, which is the neck of the weekly W in the short term, and the ma20 ($41800) weekly levels in the medium term are the levels we will follow as support.
*Not Investment Advice.