
VeChain (VET) price increased by 12% on September 13, likely due to the Coinbase listing announcement.
Although the price has formed a bullish formation, the reaction to the $0.016 region will be critical in determining whether the formation will materialize.
Is It Possible for VeChain Price to Regain Horizontal Support?
altcoin Weekly time frame technical analysis for gives mixed readings.
VET price fell below the horizontal zone of $0.016 in June. However, it regained this level (green circle) immediately afterwards. This is a bullish sign that often leads to significant upward movements.
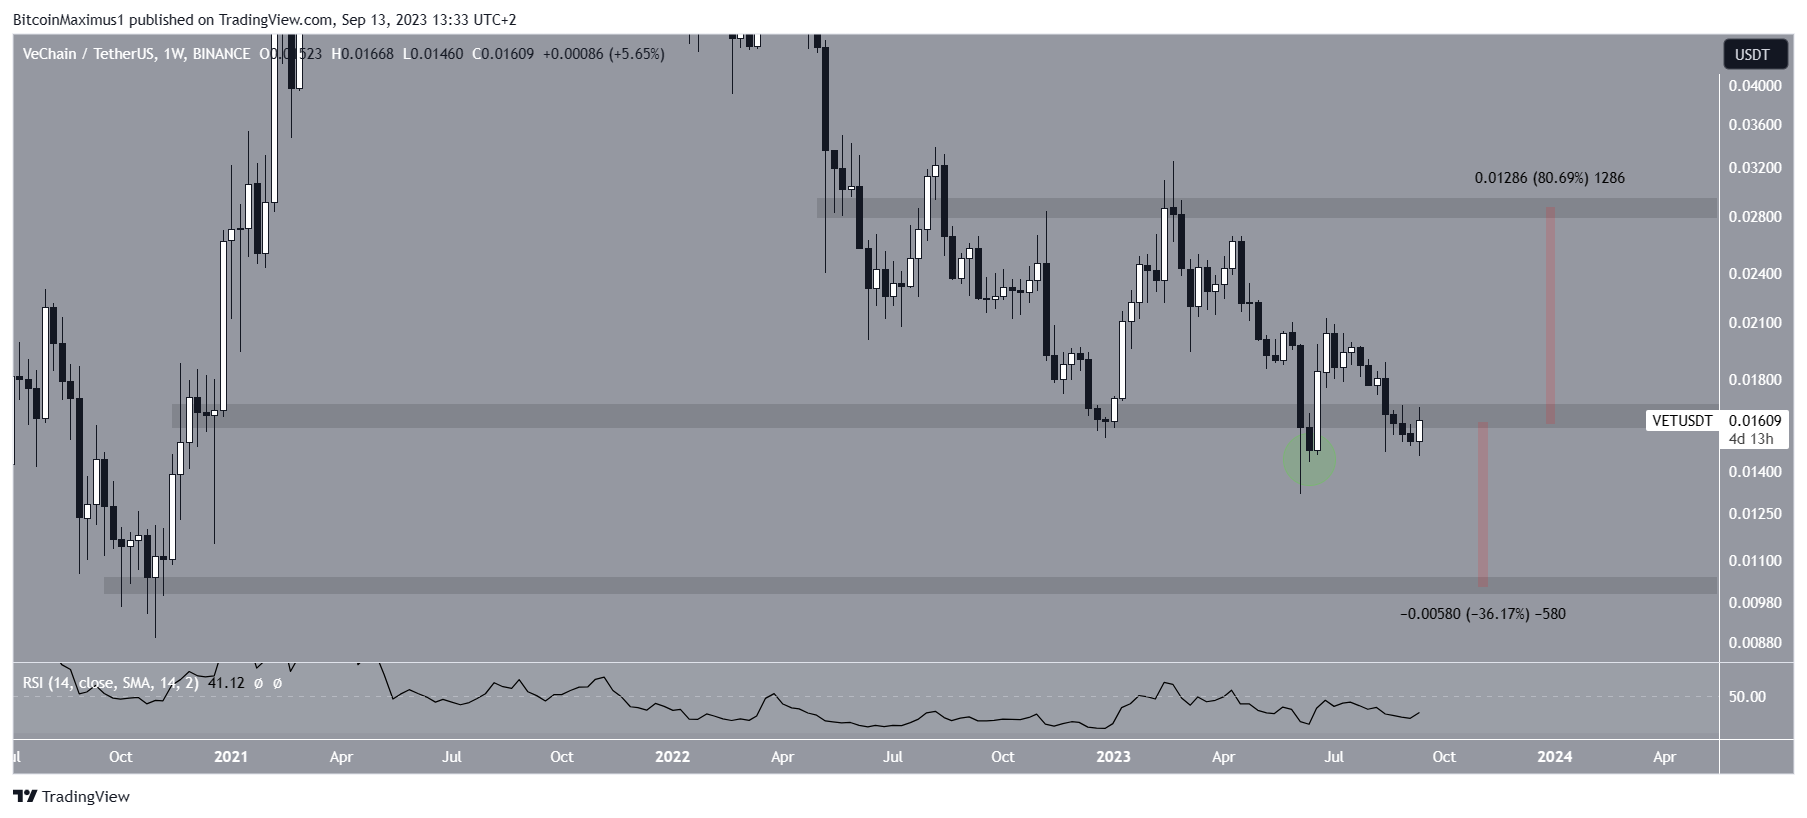
However, this was not the case for VET as the price was at risk of falling below the zone again. Whether it falls below or makes a higher low and then rebounds will play a key role in determining the future trend.
A close below the zone would likely lead to a 35% decline to the next support at $0.010. On the other hand, a recovery of the zone is possible, leading to an 80% increase to reach the $0.028 resistance.
The weekly RSI provides a mixed reading. While the indicator is still below 50, it is also moving up, creating a higher low.
Traders use the RSI as a momentum indicator to assess whether a market is overbought and to determine whether an asset should be accumulated or sold.
When the RSI is above 50 and rising, it indicates buyers gaining the upper hand, an uptrend, and potential buying opportunities. Conversely, when the RSI is below 50 and falling, it means the sellers have more control. It signals a downtrend and potential selling opportunities.
VET Price Forecast: Will Double Bottom Happen?
On September 12, Coinbase announced that it would add support for VeChain and VeThor starting the next day. announced. This announcement caused a 12% price increase.
More importantly, it confirmed the double bottom formation (green symbols) based on the price on August 17. The double bottom is considered a bull. It often leads to upward movements.
This pattern becomes even more meaningful when the RSI is taken into account. The indicator created a significant bullish divergence during the bottoms (green line). This is a bullish development in which an increase in momentum is accompanied by a price decline. As with VET, it often leads to sharp upward movements.
To confirm the formation, VET needs to break the descending resistance line that has been in place since early July. Since this line also coincides with the horizontal area at $0.016, breaking above this line will confirm a reversal of the uptrend.
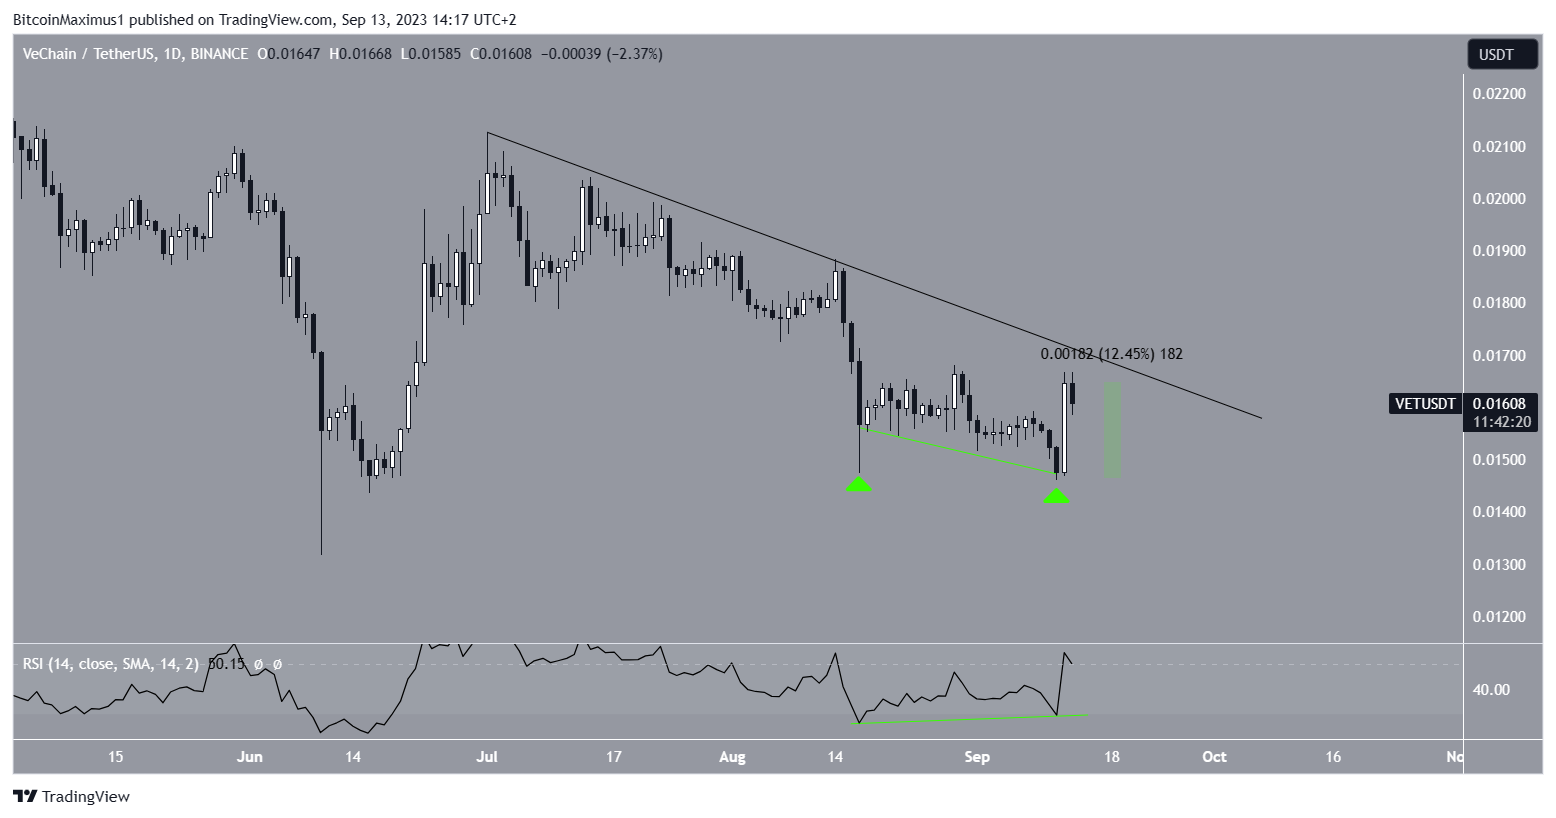
Therefore, the future VET prediction will be determined by whether the price reclaims the $0.016 level or is rejected. If the price is pulled back, an 85% increase is possible. On the other hand, if the price rejects, a 35% drop is likely.