
The Polygon (MATIC) network, which is the solution to Ethereum (ETH) on the scalability side, which is the general problem of cryptocurrencies, managed to surpass ETH for the first time on September 27 in terms of daily active address.

Another huge milestone for @0xPolygon! 🔥
We eclipsed Ethereum L1 in daily active addresses for the first time!
This is just the beginning. We are working round the clock to improve our tech, strengthen our ecosystem and increase adoption.
Let’s bring the world to Ethereum! 💫 pic.twitter.com/K4sAF1y3LT
— Mihailo Bjelic (@MihailoBjelic) September 29, 2021
Despite this data showing that there is a lot of interest in MATIC, the price is at the critical support level on the daily chart. The fact that the price has not started to rise makes investors nervous despite the positive data. MATIC, which ranks 22nd in Coinmarketcap with a market capitalization of over $7.1 billion, finds buyers over $1,072 as of the time of publication.
MA200 Impasse in MATIC!
MATIC, which broke the rising white trend line from mid-July on the daily chart with its deep decline above 30% on September 7, continues its downtrend by retesting with the September 16 candle.

It is seen that the 200-day moving average is the main support for the price of MATIC, which continued its declining series after the retest and reached the important support zone in the range of 0.89 – 1.04 dollars. Expressing the momentary level of $ 1,069, the MA200 MATIC has a very important place for the trend in price.
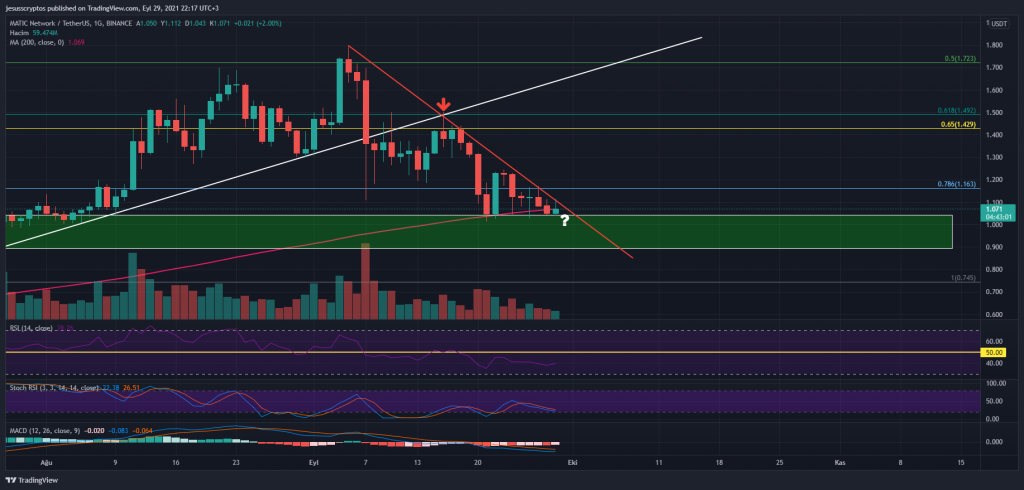
Losing MA200 support for MATIC, which has experienced a drop of up to 40% in a three-week period for now, may cause it to lose value once again. For this reason, candle closings below this level are included in the stop condition of short and long-term investors.
Finally, a red falling trend line draws attention on the daily chart. The price, which is seen to be approaching the end point of this downtrend, is expected to show a reaction in the short term.
What Will Be the Final Reaction in a Symmetrical Triangle?
In addition to the daily chart, the MATIC price, which we examined in the 4-hour time frame, shows the symmetrical triangle formation that has formed in the last week.
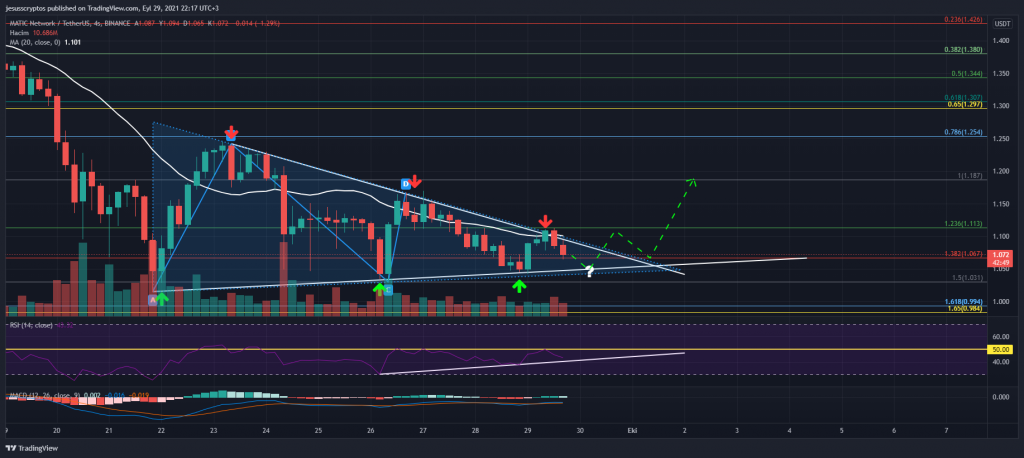
In today’s 4-hour candles, it is seen that the price, which has encountered resistance on the upper wing of this triangle, is holding the $ 1.067 support within the triangle. If the price hangs below this support, it is very important whether the lower wing will hold the price. If the price makes an upward move from here, it can break the formation upwards.
* The above does not constitute investment advice, please take your own investment decisions yourself.