
Bitcoin is about to complete its worst-performing month since the collapse of FTX. However, a few altcoins made notable gains in May. Crypto analyst Nivesh Rustgi looks at the technical view of these altcoins KAVA, XRP, TRX, RPL and RNDR. Another analyst, Aaryamann Shrivastava, delves into LINK.
What’s next for KAVA, XRP, TRX, RPL, RNDR and LINK?
Kava price analysis
The positive catalyst that boosted the altcoin price came from a mainnet update on May 17. The price of KAVA started to rise a week before the update, which increased the efficiency and security of the Blockchain. KAVA also received support from token holders’ proposals to terminate the project’s grant and reward programs by the end of 2023. Technically, KAVA is facing resistance at $1.14, the long-term support and resistance level. A successful break above this level will motivate buyers to push KAVA towards $1.50. Buyers’ downside support stands at the $0.96 and $0.80 levels.

Ripple price analysis
cryptocoin.comAs you follow, XRP gained 7.29% during the month. Also, most of the altcoin price surge has occurred in the past few days. The token has recorded an increase in daily transfer activity, which usually precedes a positive rally. Traders showered with buy orders after on-chain analytics firm Santiment reported the activity on Twitter.
According to popular opinion, Ripple, the fintech company behind the XRP token, is close to winning its securities lawsuit against the Securities and Exchange Commission. The decision is likely to come as early as June. Technically, XRP is facing resistance at around $0.54, the yearly peaks of October 2022 and 2023. A successful break above this level could push the price up to the 2022 break level of around $0.79.

TRX price analysis
Tron has gained popularity over the past few weeks, with its market-making use on centralized exchanges and reports of the network’s revenue making headlines. However, Tron’s use of decentralized finance is limited. However, it remains the leading Blockchain platform for Tether issuance. According to supply data from Coin Metrics, the amount of USDT in Tron is $40 billion. It also exceeds the stablecoin supply on Ethereum by $10 billion.
Kaiko, a crypto research firm, states that Tron’s dominance may be due to low fees that make transactions cheaper for market makers on centralized exchanges. According to Token Terminal data, stablecoin transfers lead to an increase in Tron fees. Thus, making it the second highest revenue generating Blockchain after Ethereum. TRX has a bullish break out of the ascending triangle formation with a target of $0.112. Before the bullish target of the pattern is met, buyers will face resistance near the 2022 high of $0.093.

RPL price analysis
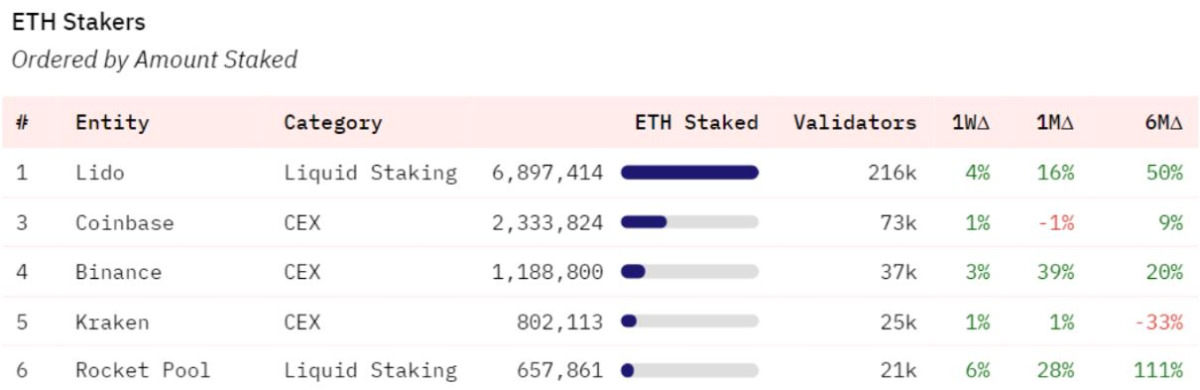
Rocket Pool is the second most popular decentralized liquid staking derivatives platform after Lido. According to Hildobby’s Dune data, it has a 3% market share of the total Ethereum stake pool. Also, it has doubled in size in the last six months.
RPL’s daily chart shows a bullish trend. Besides, RPL is forming a higher low trend capped by the horizontal resistance at $52. If buyers conquer this resistance level, RPL could witness an upside target of 60% based on the ascending triangle pattern. According to CoinGecko data, the all-time high for the token is $61.90. A price break above this level will technically put the token in price discovery mode without any upside resistance. On the other hand, sellers will target local lows of $45.57 and $37.95 in case of a correction.
RNDR price analysis
Render Token capitalized on recent artificial intelligence (AI) hype, which has resulted in an increase in companies needing graphics cards to train AI models. RNDR is an ERC-20 utility token that powers Render Network, a protocol that provides a decentralized marketplace for graphics processing unit (GPU) power. Using RNDR as a medium of exchange, Render Network brings together users who want to rent their processing power with those who have idle GPUs.
RNDR gained 5.5% in May, posting a strong rise in the second half of the month. Data from Nansen shows that the smart token holding for RNDR has been declining since the beginning of this year. However, the number of unique smart wallets holding RNDR increased linearly over the same period.

The RNDR showed significant volatility around the $2.13 resistance and support level. If it builds support above this, it is possible for the token to enter a key pivotal parallel range between $3.19 and $2.13. Meanwhile, there is minimal resistance above $3.19. Therefore, the altcoin has the potential to reach the 2022 high of $5.29. On the downside, buyers are likely to find support at the local lows of $1.62 and $0.90.
LINK price needs to reach this level
Chainlink is trading at $6.46. LINK failed to rise above $7 after the crash in early May. The altcoin, which has been stuck under for nearly three weeks, has left most of its investors desperate for a recovery. The majority of these LINK holders are currently underwater. So these have been some of the biggest losers in the crypto market.

At the time of writing, about 78% of 623k addresses are at loss. Therefore, he is waiting for a trigger that could potentially make their supply profitable again.

This trigger will only occur when the LINK price rises by about 6% to $6.85. The reason why this price level is so important to LINK is that a wall of demand worth $2.3 billion is standing here. The 40,000 addresses that bought around 356 million LINK tokens at an average of $6.85 continue to make money once the altcoin crosses the aforementioned mark.

In general, such events tend to be bullish triggers for an asset. This is also critical for the LINK price right now. Because if it doesn’t, investors are likely to exit the market. Beyond acting as a catalyst to start a buying spree, a rise to $6.85 will also give the altcoin price some much-needed support. This level is just above the 50-day Exponential Moving Average (EMA), a key technical indicator Maintaining as a support ground will allow LINK to have a chance to surpass the $7 level and eventually hit the 200-day EMA at $7.10. A daily candlestick close above this level will bring LINK price to April levels. Thus, it will support the eventual recovery of the 17% slump in mid-April.
Contact us to be instantly informed about the last minute developments.twitter‘in,Facebookin andInstagramFollow andTelegramAndYouTubejoin our channel!
KAVA, XRP, LINK, TRX, RPL and RNDR: What’s Next?