
The decrease of 10 percent in Bitcoin during the day made the entire crypto market bloody. Although it rose above $ 50,000 in early September, BTC, which could not hold here, seriously frightened its investors with its $ 10,000 decline. After showing signs of recovery, BTC experienced a rise up to $ 49,000.

It is seen that important supports and resistances are working in Bitcoin, which has lost its struggle in the last few days and has decreased to $ 42,500 during the day.
On the 4-hour chart, key levels are seen for the leading coin, which fell below the MA20 ($46,987), MA50 ($46782) and MA100 ($47,371) moving averages.
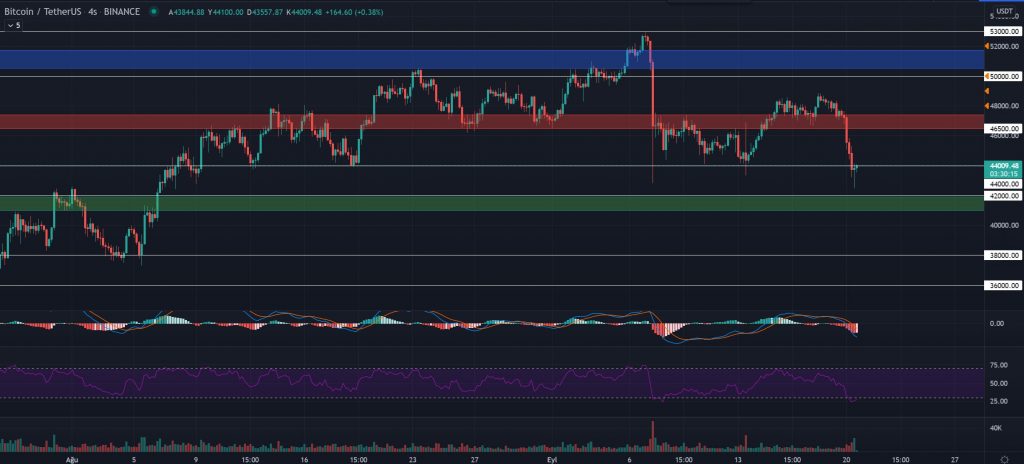
The critical support areas for Bitcoin appear to be the $44,000 and, more importantly, the $41,000 – $42,000 range shown in green.

In this context, investors are up-to-date:
- They can buy gradually up to the green area level, stop when they fall below the green area, and in case of an increase, they can sell their profits at the red area levels.
- In case of upward movement; Investors who buy with the break of the red area can choose to stop at 44,000 or below the green area, according to their average. The levels where those who buy at these levels will take profit will be the blue area.
- Investors who currently hold BTC and have not broken it can wait for the green zone level to stop, or even below $ 40,000 according to their average. Because the 4-hour closures below these levels can trigger the decreases to $ 38,000 in the first place and then up to $ 36,000.
Investors holding altcoins can also apply these strategies. Because these supports and resistances in BTC will be very important for the movements in altcoins.