
Glassnode last month for January bitcoin published the evaluation report.

After the declines in the report, the table in the in-chain data was examined and it was evaluated whether a long-term bear market was entered.
The following explanations glassnodeTranslated from the 4th week report of 2022. The graphics are again by Glassnode:
“In this week’s newsletter, we will try to assess the damage and determine the likelihood of a prolonged bear market being played out.

Identifying a Bitcoin bear market is no easy task. We try to add some color to the discussion by using historical investor behavior and profitability patterns as our guide.
Price
Bitcoin price has dropped by 50% from the ATH level.
With the bulls now firmly on their hind legs, such a heavy drop is likely to change investor perceptions and sentiment on a macro scale.
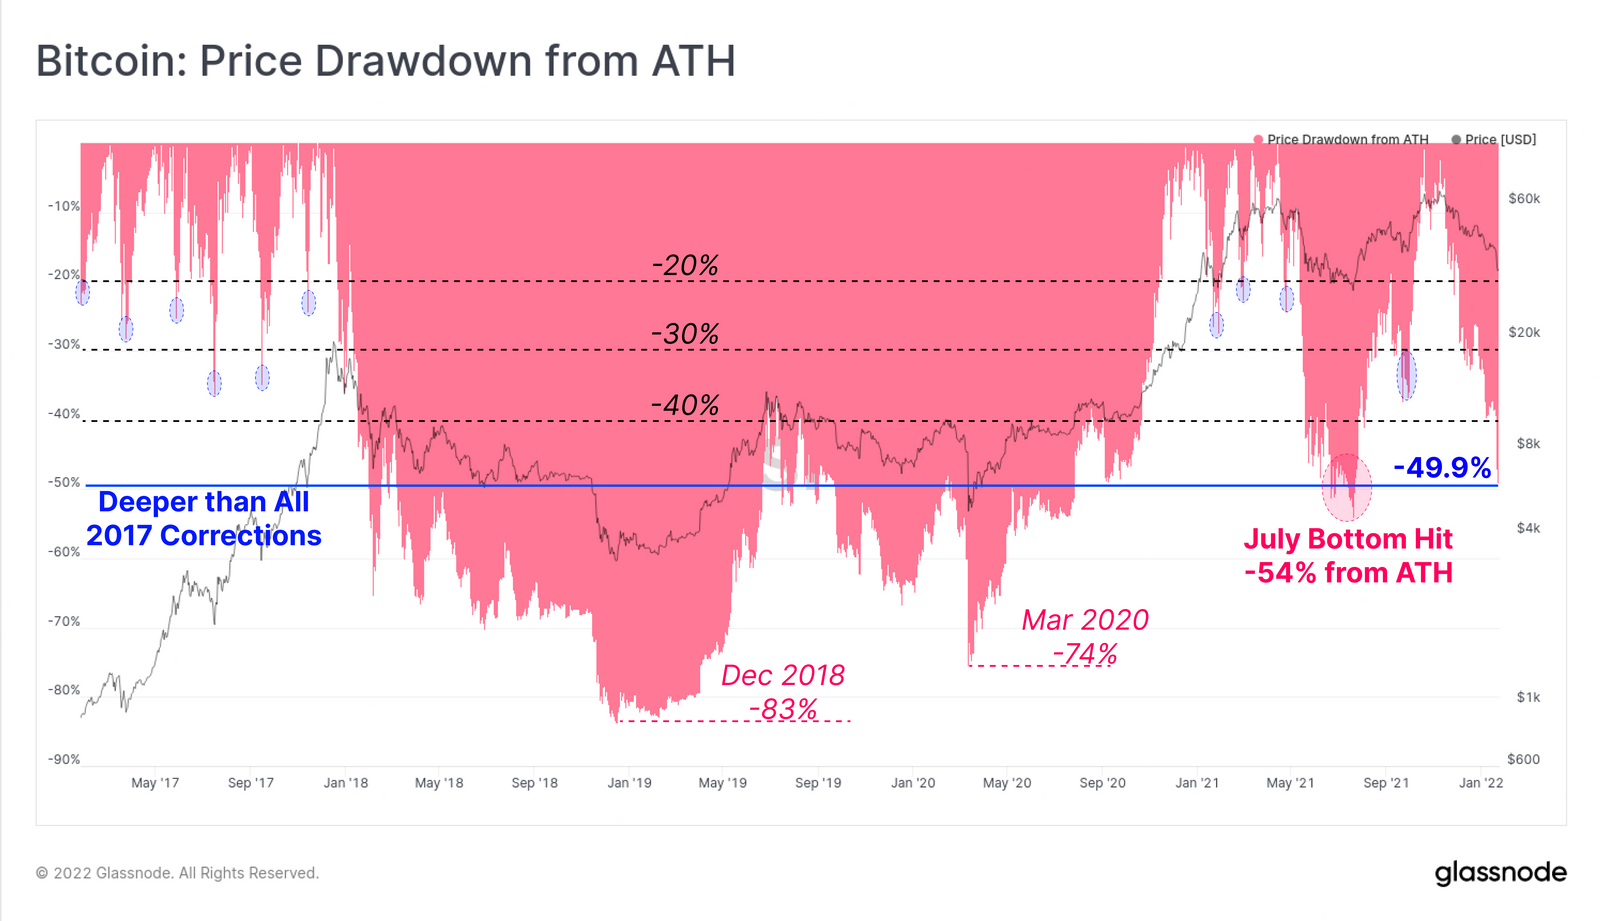
Drops of this magnitude are significantly higher than the -20% to -40% range seen in the 2017 and 2020-21 bull cycle corrections.
NUPL
The Net Unrealized Profit/Loss (NUPL) metric presents overall market profitability as a ratio of market value. NUPL is currently trading at 0.325, which indicates that the equivalent of 32.5% of Bitcoin market cap is held as unrealized profit.
This is in stark contrast to the much higher profitability values of ~0.75 in March and ~0.68 in October last year.
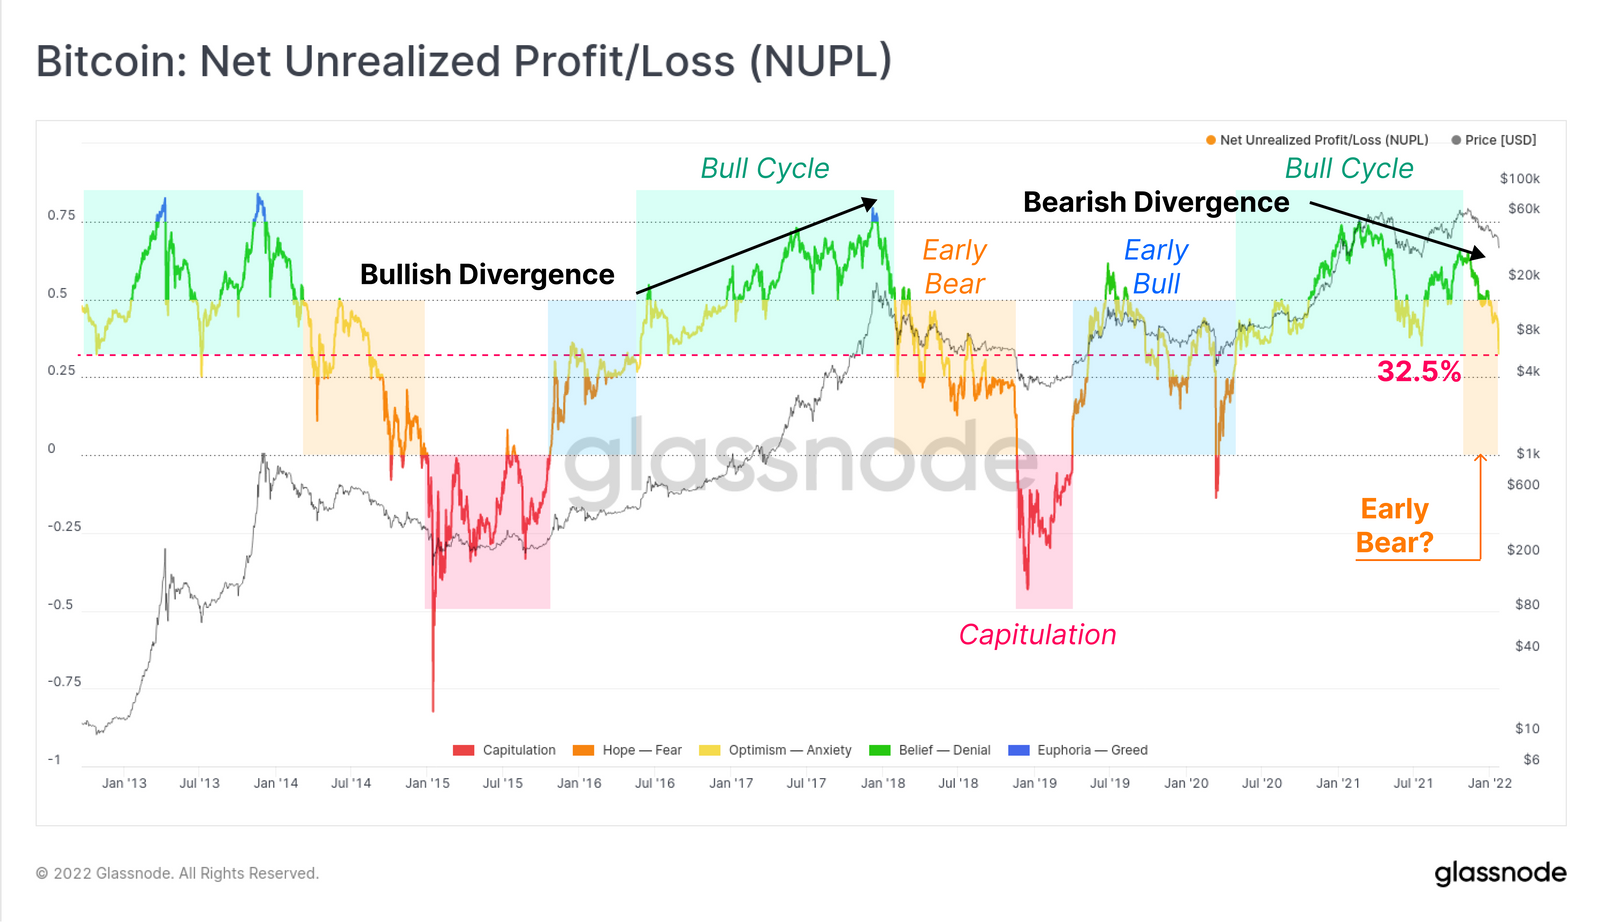
Considering previous cycles, such low profitability can be seen in the early and middle phase of a bear market (orange). Based on this observation, it can also reasonably be argued that a bear market started in May 2021.
MVRV
The MVRV Ratio is calculated by dividing market value by actual value; and is a useful tool for identifying periods of high and weak investor profitability.
With the current MVRV-Z reading of 0.85, the market is within the bearish markets visited region and bears similar to the NUPL metric above. Generally speaking, such low MVRV-Z values are achieved when:
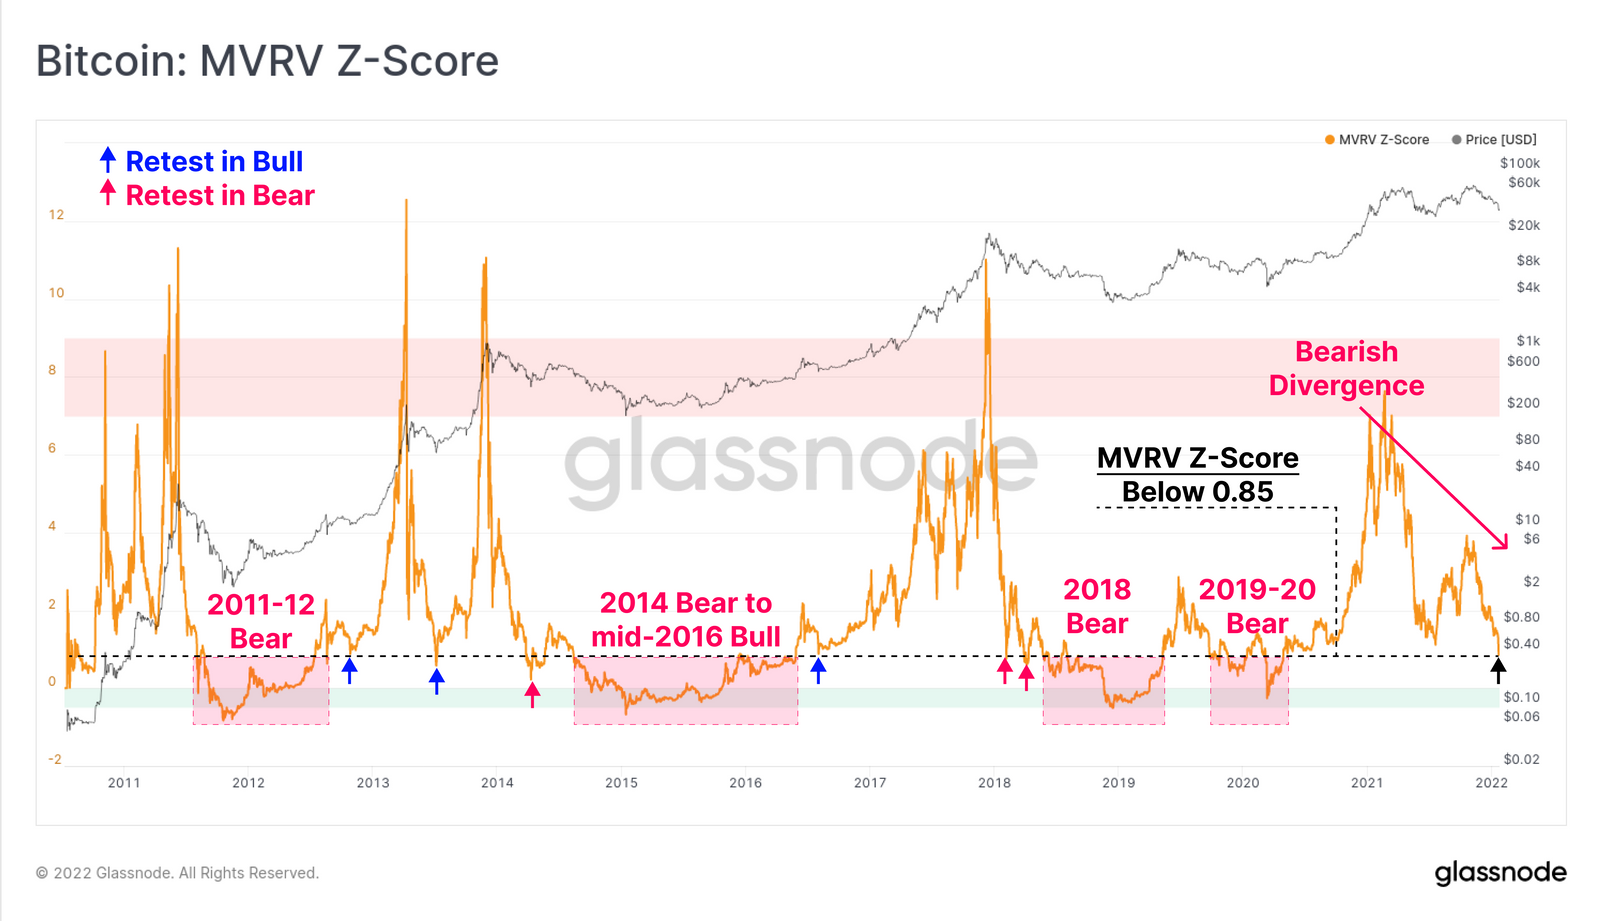
Steep corrections in bull markets (blue arrows) followed by a usually return to new highs.
The market panics, investors capitulate, and it’s also often preceded by a strong relief bounce.
Mid-late bear markets (red boxes) where MVRV-Z is trading below 0.85 represent a period of very low profitability, low sentiment and sustained investor losses.
According to this metric, the bulls need to take a big step, otherwise the odds are supporting the bears. However, if history is to act as a guide, A surge of relief is also likely in the near term.
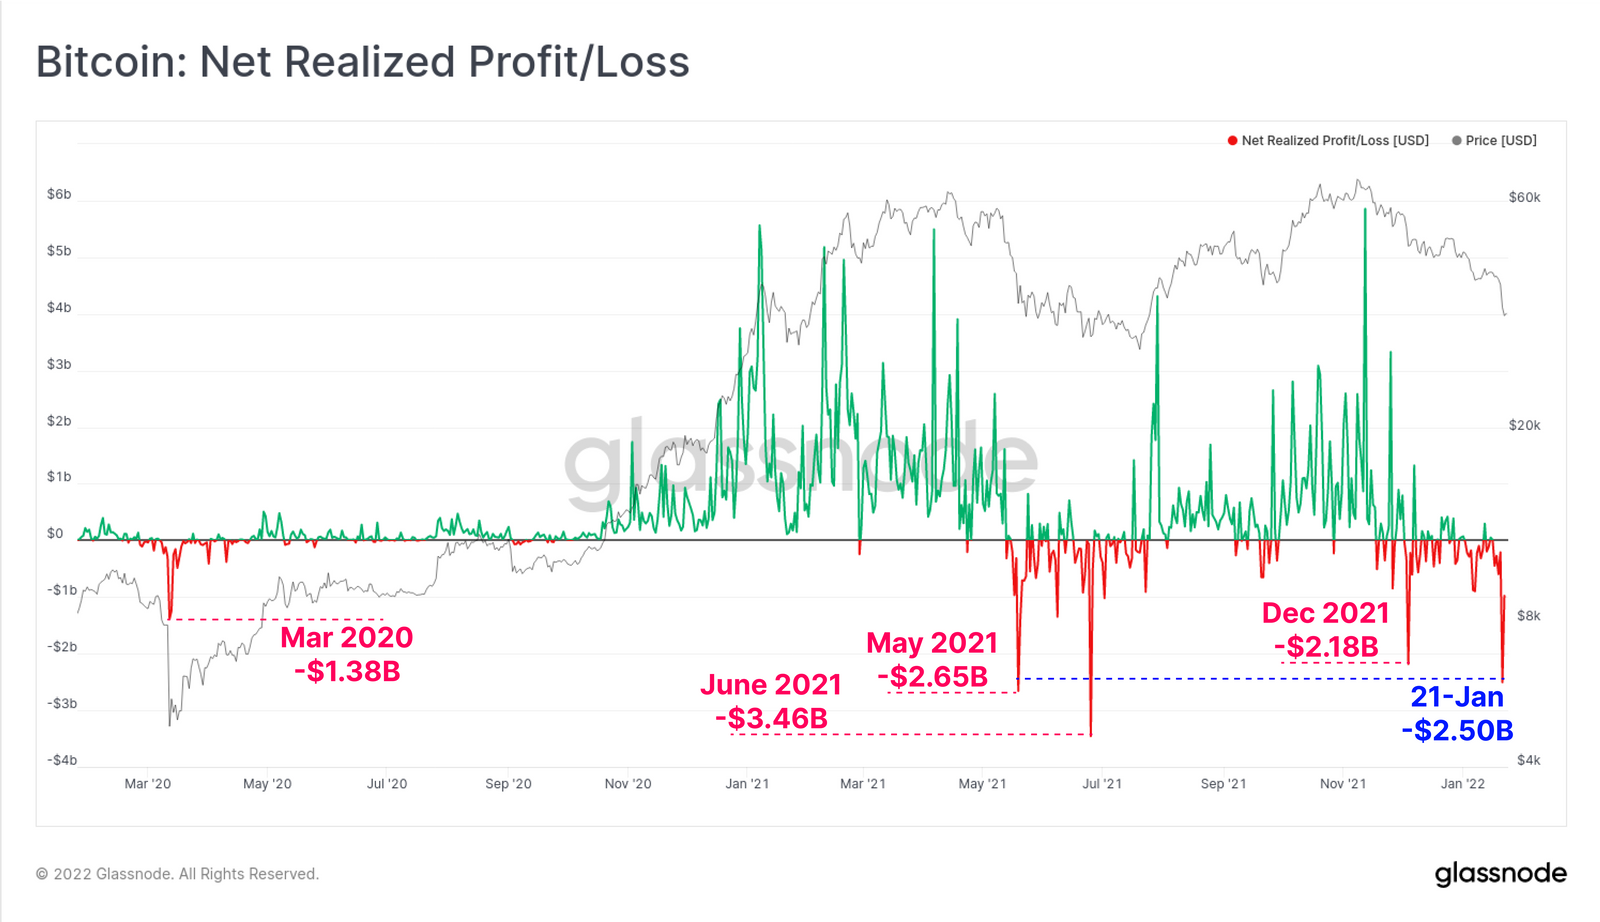
General Table and Evaluation of Damage
We’ve now determined that multiple signals point to a macro-scale bearish trend in the game.
As it hit weekly lows on Saturday, investors posted a net loss of over $2.5B as they spent the coins they were holding at a loss. This is the largest capitulation event of this decline and is almost equivalent to a net loss of $2.61B in May 2021.
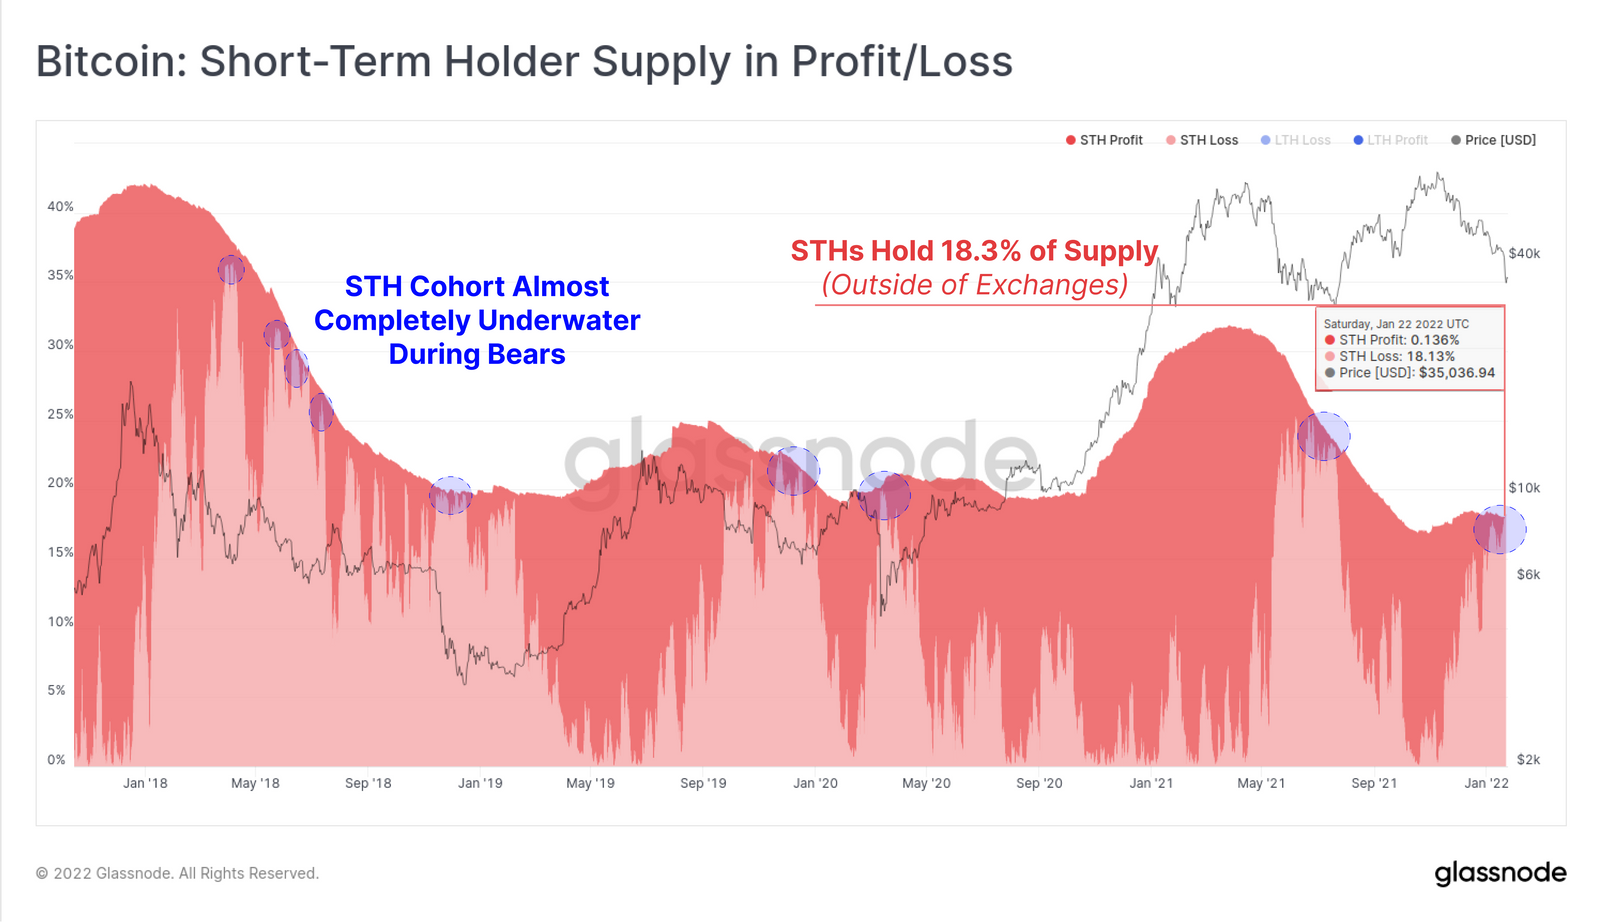
STH
We see that Short-Term Holders (STH) currently own about 18.3% of the Bitcoin supply. The light red area in the chart below represents the currently held loss ratio and as of this week almost the entire supply of STH is underwater. This means more psychological selling pressure.
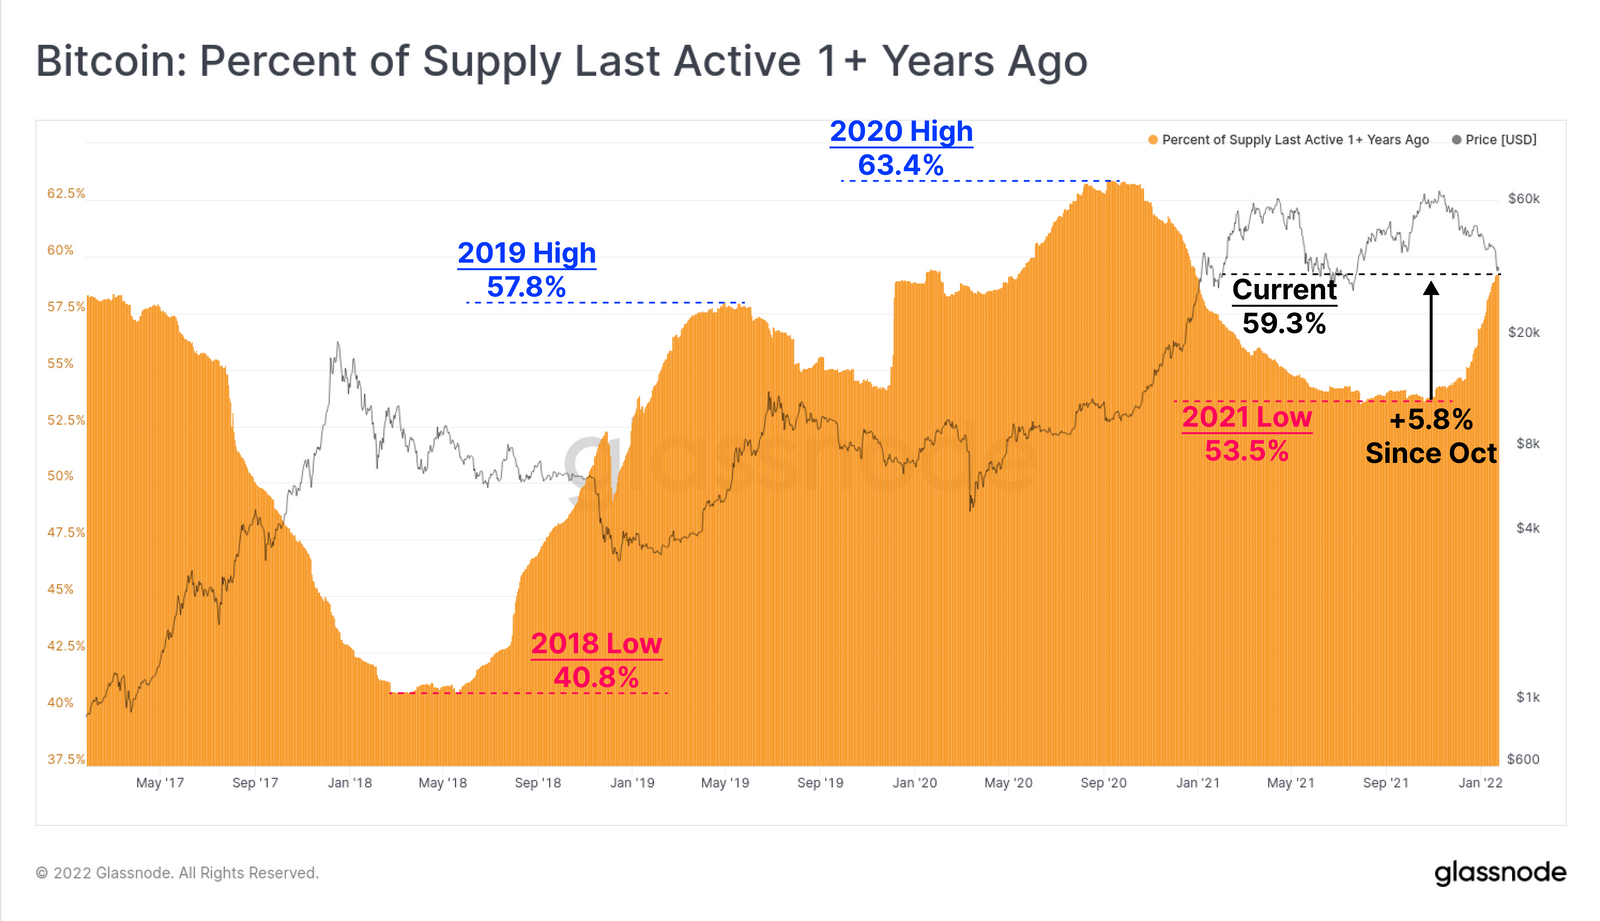
Old Coins
When we look at Bitcoins that were last bought 1 year ago and not moved, we see that there is an increase. This once again has similarities with a bear market where only HODLers and patient accumulators remain.
summary
It is difficult to define a bear market given the volatility. Therefore, it is used as an indicator of potential and actual sell-side activity. We look at investor psychology and profitability.
What we’ve spotted this week is significant realized losses, a steep drop, a return to the HODLer-led stockpile, and top buyers taking every opportunity to get their money back.
If it looks like a bear and walks like a bear, it may well be a bear. But as with so many things in the last two years… could this time be any different?
That is a question we will continue to explore in the coming weeks.”