When we look at the global indices in general, there has been horizontal activity in the S&P 500, Nasdaq, Dow Johnes indices especially for the last 2 months.

We can see the reflections of these effects on cryptocurrencies together with the horizontal movement on the macro economy side.
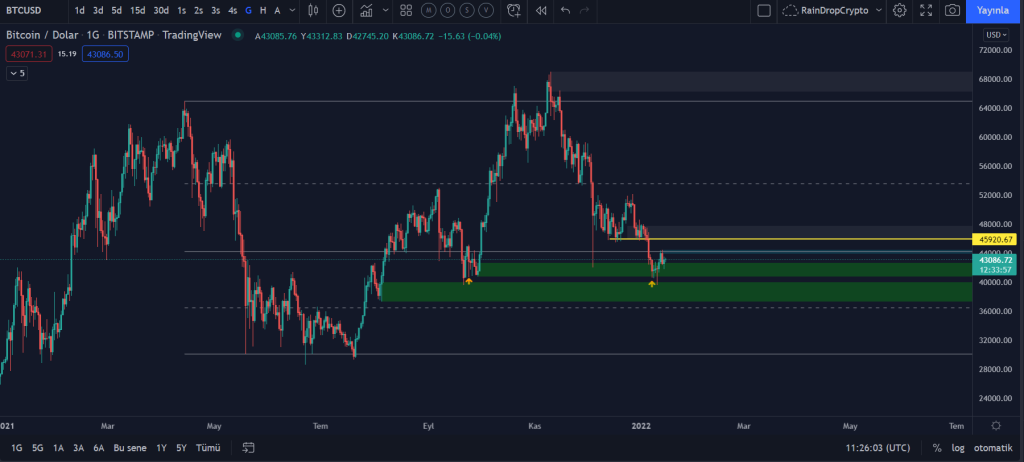
At the beginning of the week, with the pullback that came with selling pressure in Bitcoin, the price declined to the $ 39,600 support level.
With the reaction from this region, it turned upwards and reacted up to the resistance levels of $ 44,000.

However, BTC failed to stay at this level and sales came. On the daily timeframe, we can see it holding above a $40,700 – $42,600 support line.
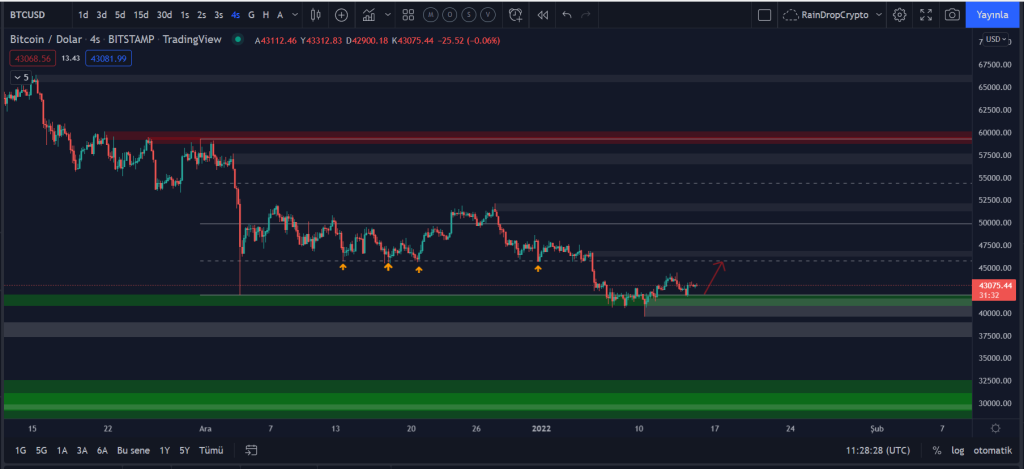
When we look at the 4-hour time frame, since November 30, 2021, the price movement continues in a range consisting of the high point of $ 59,200 and the low point of $ 39,200.
Currently, it is trying to turn its direction up again by drawing a minor uptrend with rising bottoms with support at the $42,000 level.
If it does not break this trend and the support level, there are $43,900 and $44,500 resistance levels for a possible uptrend in a short time.
The most important resistance level is the band range of 45.700 – 46.800, which used to be the support level and is now the resistance level.
Testing and breaking this previously untested region and holding it above this region will be important for the continuation of the rising trend.
If this happens, the next possible resistance level could be targeted at $53,400 and $54,400.
If this region is tested and there is selling pressure, the $43,900 and $44,500 points will be the first support levels in possible retracements.