
Bitcoin dominance chart (BTC.D) has reached a strong resistance level and a signal for a downtrend has also started to appear. Expectations are that the graph will drop soon.
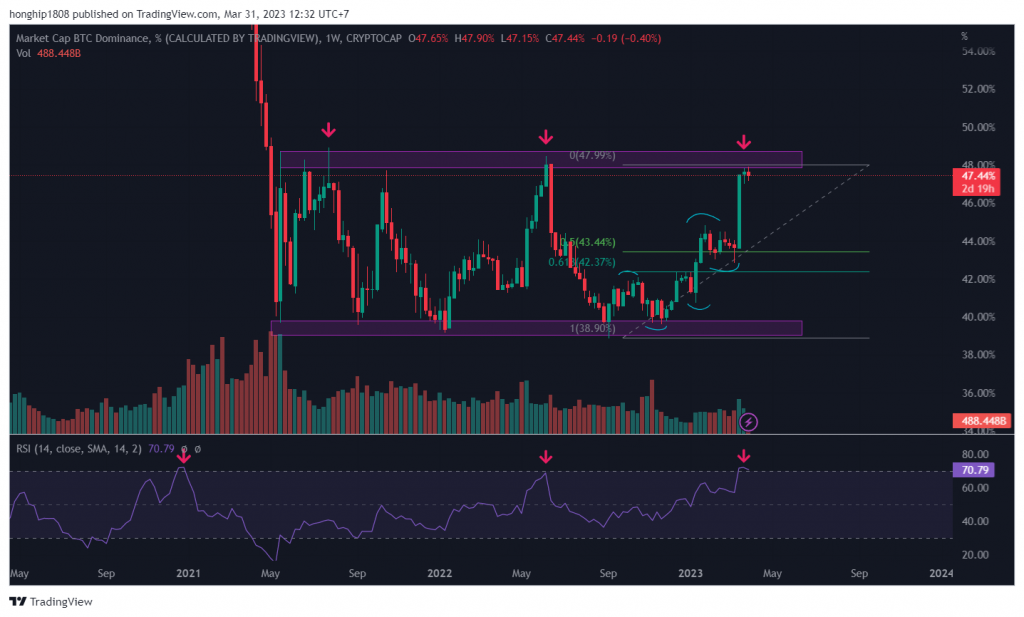
Bitcoin Dominance (BTC.D) has been trading in the range of 39% to 48% since the beginning of May 2021. The price has repeatedly confirmed the support and resistance of the range. BTC.D formed an uptrend structure after bouncing from the 39% level on September 9, 2022 and rose to the 48% range resistance.
Indeed, the weekly RSI indicator has moved into the overbought territory (indicated by red arrows) after frequent corrections in previous cases. The formation of a Pinbar candlestick last week also supports this possibility as it shows hesitation from the bull side as it approaches a strong resistance level.
Therefore, it seems likely that BTC.D will be rejected from this level once again. In this case, it could return to the 42.3%-43.4% support range formed by the 0.5-0.618 Fibonacci retracement support zone and the horizontal support zone.
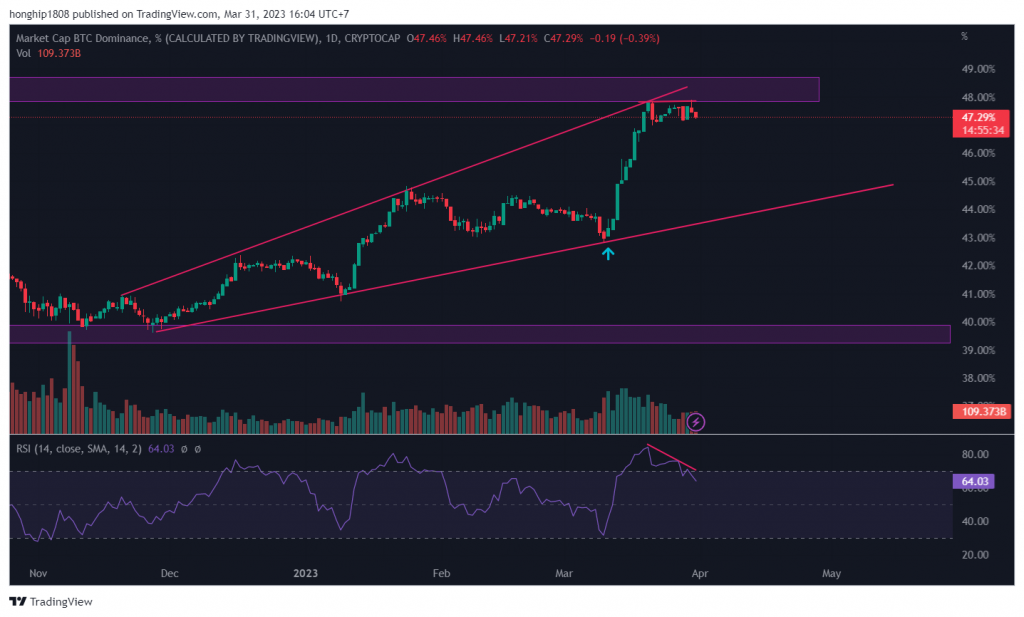
BTC.D has been trading inside an expanding wedge since November 2022. After the price bounced off the support line of the wedge on March 10 (green arrow), it tested the resistance line of the wedge once again.
As a matter of fact, the chart was rejected from the resistance line and formed a double top pattern. This often indicates a decline. In addition, the resistance line of the wedge is also coinciding with the long-term zone at 48% and is getting stronger.
The RSI indicator also created a bearish divergence in the overbought zone and dropped below the 70 level. Therefore, BTC.D is likely to continue trading inside the expanding wedge for a while. If so, it could retest the wedge’s close to 43.5% support line.
As a result, expectations are that BTC.D will be rejected at 48% and will begin to correct. The potential target for this correction is the 42.3%-43.4% range. A decrease in dominance could theoretically help a recovery in altcoin price. However, when the graph goes above 48% again, all these predictions will be invalid.
You can follow the current price action here.