
bitcoin (BTC) price remains strong in terms of technical data and fundamentals. Despite these data, breaking above the “rectangle” pattern at $64,000 is very important to drive the uptrend.

Bitcoin (BTC) bulls continue to rise despite the current crypto market conditions. Consolidating between $58,715 and $64,108 since October 22, BTC is trying to break out of this range.
Bitcoin Fear and Greed Index is 73 — Greed
Current price: $61,138 pic.twitter.com/KYB03qZrxQ— Bitcoin Fear and Greed Index (@BitcoinFear) November 4, 2021
Bitcoin’s ‘fear’ and ‘greed’ index is currently 73, which seems close to ‘greed’. This means that people seem to have broken the fear.
BTC price, which has been stagnant for the past two weeks, needs more support from the market to determine its direction in the short term. Currently, BTC/USD price seems to have consolidated above $62,000 after posting less than 1% gains in the last 24 hours.
Since October 22, Bitcoin has been trading sideways between the $58,715 and $64,108 price range. This indicates price consolidation and a decrease in price volatility. This has been confirmed by the Bollinger Bands (BB) squeezing towards each other.
Bounced from the psychology level of $47,000 on Oct. 4, the bulls regained strength in the market, pushing BTC to an all-time high. The price rose as high as $67,000, which led to a 43% rally in the price.
Although BTC price is currently at $62,000, it is in a downtrend and appears to have “formed a rectangular pattern” on the daily chart. Noting that the rectangle pattern has no defined bullish or bearish breakout, but a break of the upper border of the rectangle around $64,108 will trigger a bullish move for BTC.
Bitcoin price seems to be struggling with immediate resistance around the $62,631 level, which coincides with the middle border of the ascending channel. For the bullish move to be confirmed, BTC price must close above this level to mark the upper boundary of the rectangle at $64,108.
If Bitcoin (BTC) price surpasses this level, the rise will be confirmed and then the ATH level will be retested at $67,000. This level also coincides with the upper end of the ascending channel.
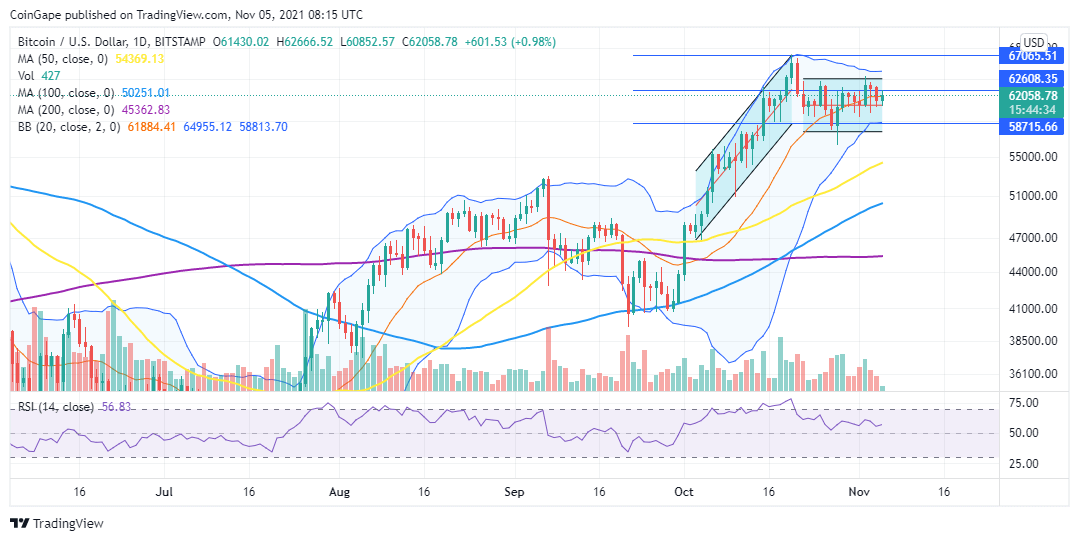
If Bitcoin (BTC) closes below the immediate support level below $60,950, it will seek support at $58,715 where the lower bounds of the ascending channel and BB overlap.
Disclaimer: What is written here is not investment advice. Cryptocurrency investments are high-risk investments. Every investment decision is under the individual’s own responsibility. Finally, Koinfinans and the author of this content cannot be held responsible for personal investment decisions.