

Avalanche (AVAX) The Ichimoku Kinko Hyo system on the price chart provides a detailed overview of any market by determining past, present and future time and price levels.

In this analysis, 3-week chart, weekly chart and daily chart are interpreted.
Avalanche (AVAX) 3-Week Ichimoku Kinko Hyo Chart
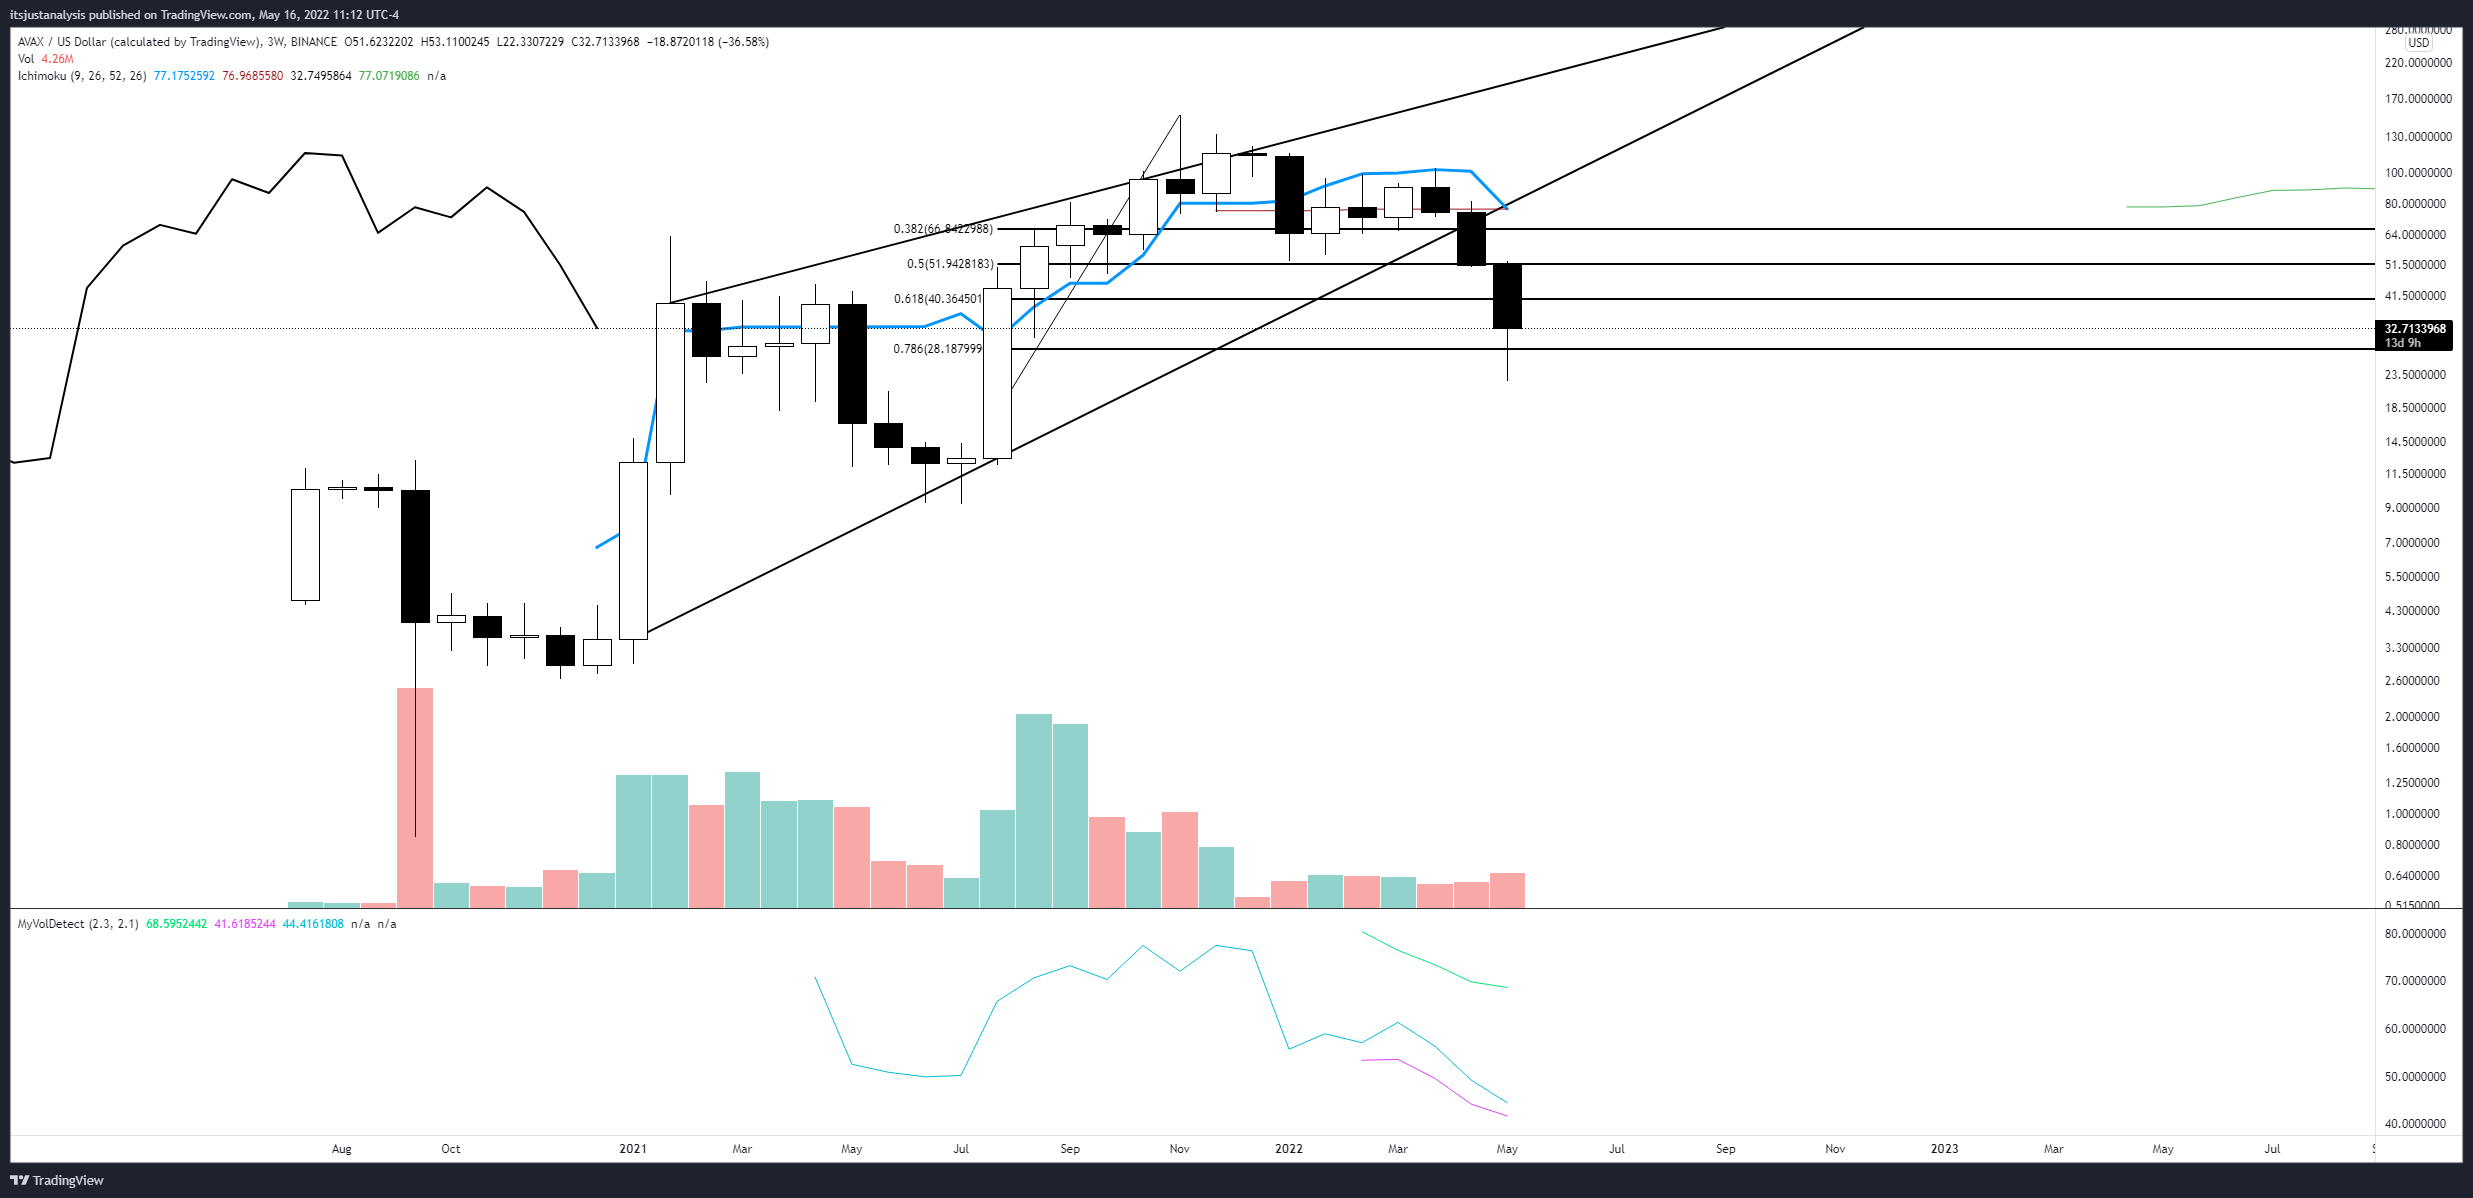
AVAX’s 3-week Ichimoku chart doesn’t give us a full set of Ichimoku indicators, which not many altcoins do, but that doesn’t mean there’s nothing to learn from the chart. First, the breakout from the ascending wedge put AVAX closer to the 161.8% Fibonacci extension, giving the bulls hope that the low is coming.
From the oscillator perspective, AVAX at an all-time low and near the lower band, possibly preparing AVAX for a monster rally soon. However, the upside potential may be limited to the $80 value area where the lower trendline of Tenkan-Sen, Kijun-Sen and the ascending wedge is located.
Avalanche (AVAX) Weekly Ichimoku Kinko Hyo Chart
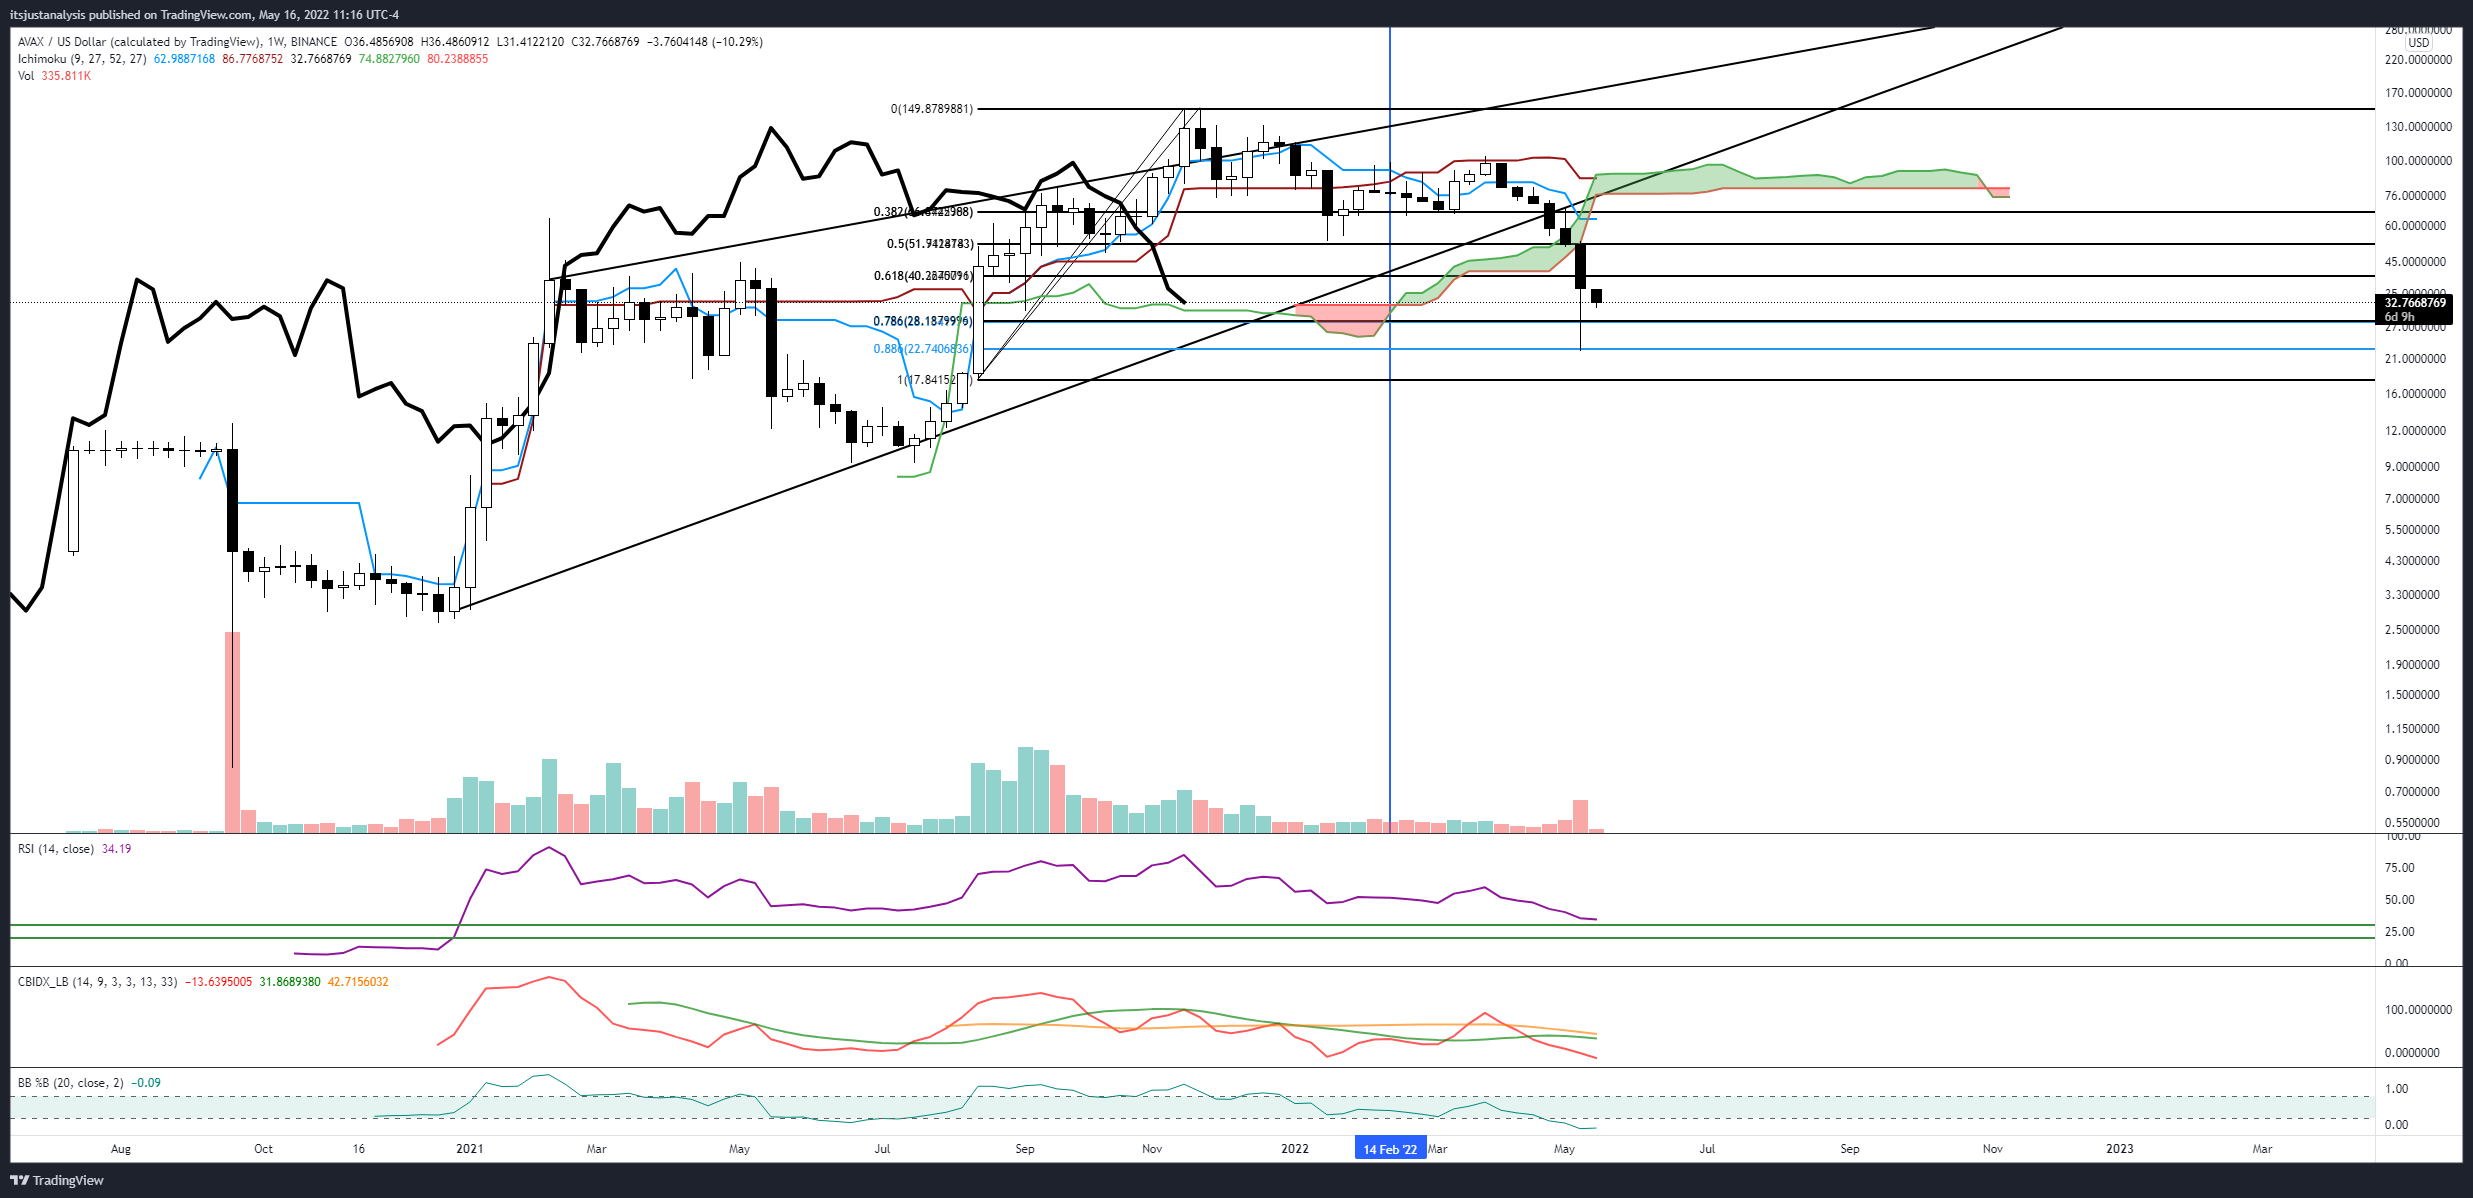
AVAX’s weekly price chart shows a clearer situation for a bottom than the 3-week or daily charts. The critical Ichimoku level to watch is Chikou Span. Traders often forget or do not know that Chikou Span will react to the same support and resistance levels that the current price gives. Chikou Span versus the top of Ichimoku Cloud (Senkou Span A). So why could a jump at $33 occur? You can have a look at the oscillators.
The Composite Index is at an all-time low. %B is at an all-time low.
The Relative Strength Index remains in bull market conditions and hovers just above the 30 level. If the RSI reaches 30, the RSI moves into bear market conditions. If the RSI is just above 30, it could mean a massive fraud, triggering a bear trap and launching higher prices.
Avalanche (AVAX) Daily Ichimoku Kinko Hyo Chart
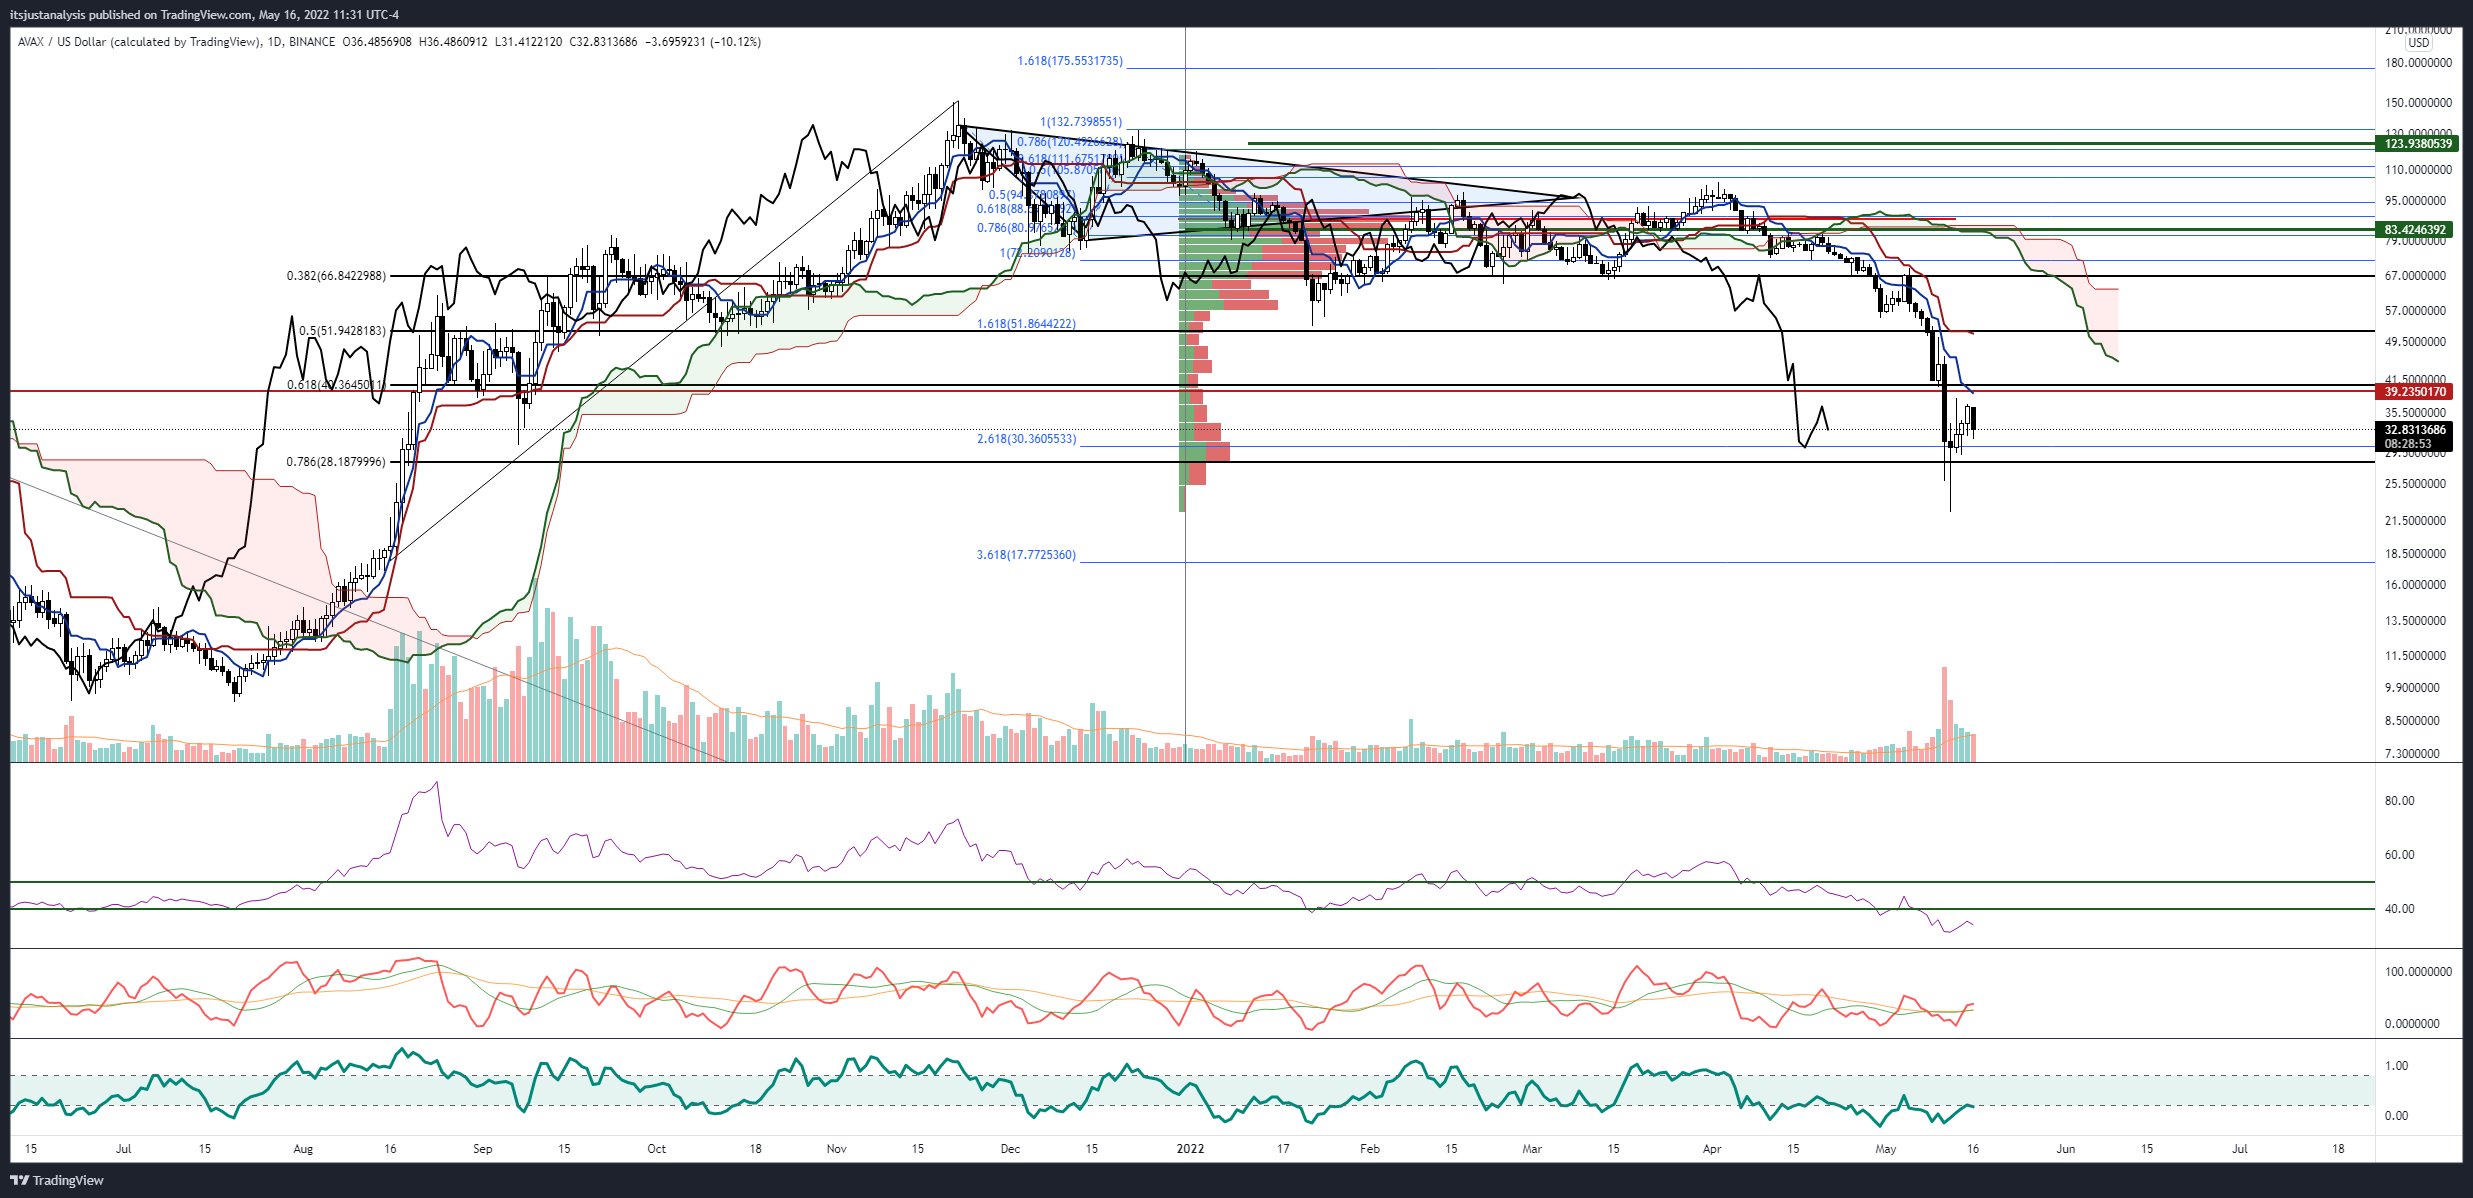
The daily chart shows that AVAX is suffering from the same situation as the broader crypto market: a massive pullback from last weekend’s gains. However, in the early afternoon of the New York session, there are signs that the buying volume is returning.
As a result of last week’s sell-off and recovery rally, it was the single largest collection of volume participation since September 2021. A move higher appears to be imminent for AVAX due to the new high volume node forming at $30 and reversal signs on the 3-week, weekly and daily charts.
Any near-term upside potential is likely limited to the $50 value area.
Disclaimer: What is written here is not investment advice. Cryptocurrency investments are high-risk investments. Every investment decision is under the individual’s own responsibility. Finally, Koinfinans and the author of this content cannot be held responsible for personal investment decisions.